Part 2 : Learning Hands-on Machine Learning with Scikit-learn Keras and Tensorflow
Abhijit Ramesh / March 09, 2021
28 min read • ––– views
Preface
This is my second blog on learning Hands-on Machine Learning with Scikit-Learn, Keras and Tensorflow. As always this blogs would contain my thoughts and notes while reading the book. If you would like to follow along please find the book here.
In this blog, I am exploring End-to-End Machine Learning Projects. Pretending to be a newly hired Data scientist what are the steps that he/she would have to take while working on a Machine Learning Project. Here, we are working at a real estate company.
Data Set
In my last blog, I have explained why we should use Real world dataset compared to some syntactic dataset because this would have a lot of noise and since we are choosing the same from a real project the data would have patterns that would occur in nature. If we learn by dealing with such dataset we would be replicating the job of a real data scientist which is what the goal for this blog is.
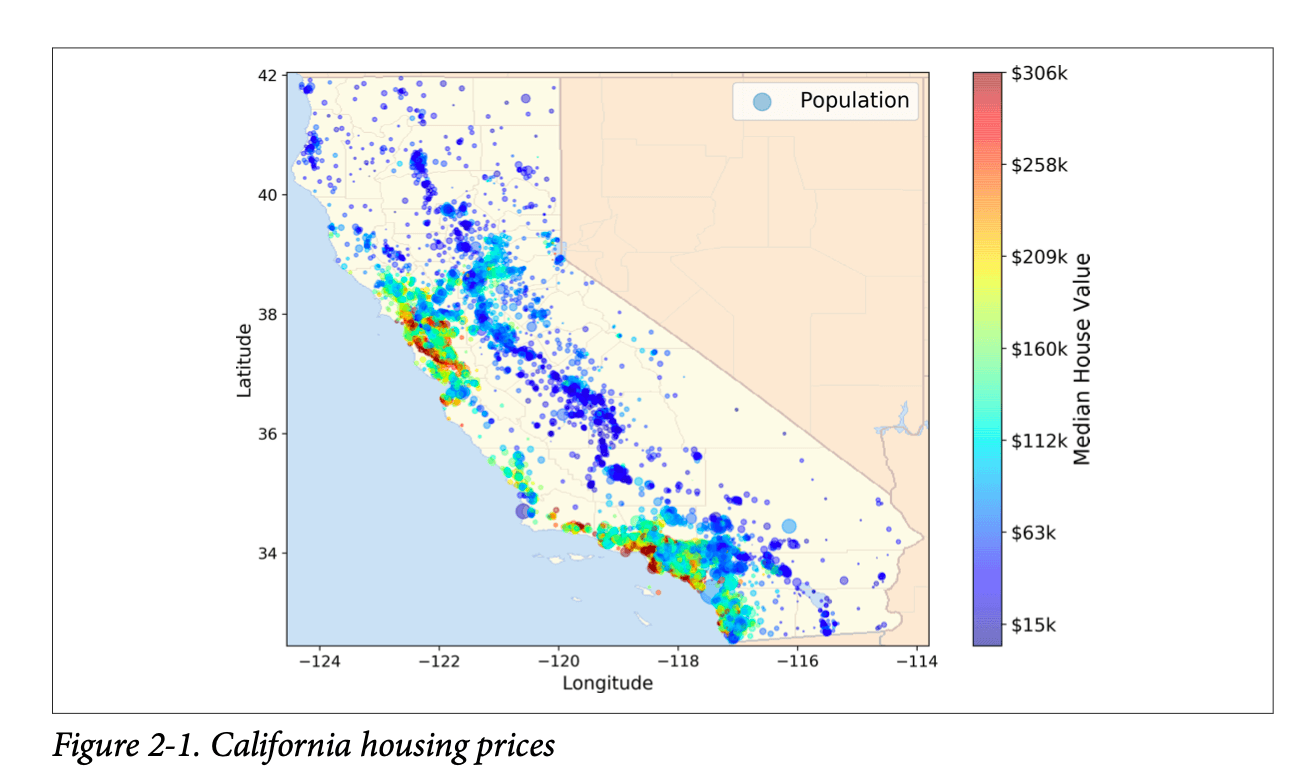
For this project, we would be using the California Housing Prices dataset from the StatLib repository.
Look at the Big Picture
The goal is to make a model that is capably predicting the median housing price in any district when it is given other metrics like population, median income, and the district.
For any machine learning project, there is generally a checklist that is to be followed Aurélien Geron the author of Hands-on Machine Learning with Scikit-Learn, Keras and Tensorflow has made a really good one.
The checklist is a very generic one but it should work for most cases and like everything in software engineering you should adapt this to work with your goals.
Frame the Problem
There are lots of paper in machine learning coming day after day and very often there is a state of the art model on some task that we can use to get a job So we should probably see what is the state-of-the-art model for our task and train and put this in production right? Well, No.
The state-of-the-art model would not be the best model for our use-case we need something that would fit right in depending on what role our model is playing in the whole project so the first task is to get the intuition where our model fits in. So we would have to ask our boss what is the role of our model and he/she replies the model output (the district's mean housing price) is fed into another model along with some other signals. This is very crucial because we can determine weather or not to invest in a given area of the project or now.
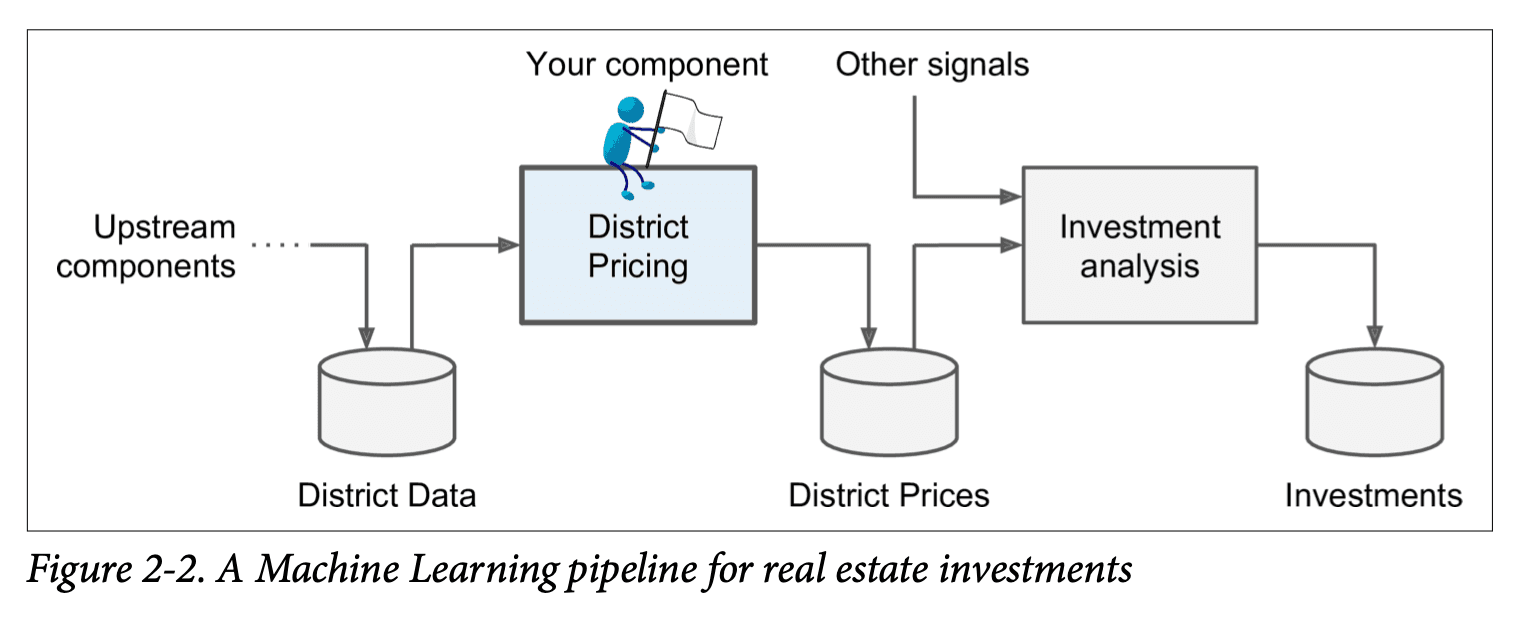
Pipleines
These are data processing components, they are very common in Machine Learning Systems Engineering. There are lot of data to manipulate and transform in a machine learning system.
Generally how this works is each component would take data from one data store as input and then perform some operation in the data and output this to another data store. This model of system engineering is done so that each team can focus on a particular component. If any of the components stop working the development and system should run for a fairly good amount of time until it is fixed but if this remains in the stop stage for a long time the data gets stale and eventually, the system starts to underperform we know this because we learned how online learning works in the last blog.
The next thing to consider how the current system is working probably might be a non-machine learning approach probably this would be done by experts: a team who is gathering and analysing the data they would be using some sort of complex calculations to figure out the median price and there might be a big margin of error for this data and is probably the reason to shit to a machine learning-based approach.
The next thing is to figure out the problem, is our system supervised, unsupervised , semi-supervised or reinforcement learning? Is it classification task, regression or something else completely. Should we use batch learning or online learning and so on.
Well since we are given the labelled data we should opt for a supervised learning model. Since we have many variables this seems like a regression task and the prediction is made for a single variable so that means we are going with a univariate regression. We don't have a continuous stream of data so lets do batch learning.
Select a perfrormance measure
Now we need to define on the basis of what we are going to measure the performance of our model that is typically the error the function and for most regression task the preferred error measure is RMSE or Root Mean Square Error.
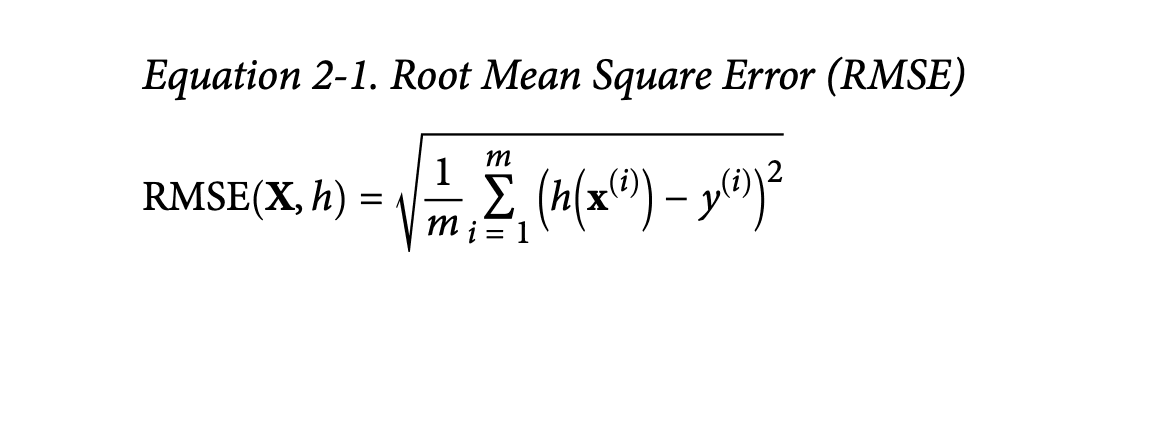
Here,
m is the number of instances in the dataset we are calculating the error on.
is a vector of all feature values of the i-th instance in the data
is its label
X is the matrix containing all the feature values of all instances in the dataset. There is one row per instance and the ith row is equal to the transpose of x(i).
h is the system's predicted function.
and finally
RMSE(X,h) is the cost function measured on the set of examples using hypothesis h.
Check the assumptions
It is good practice to verify the assumptions we have made we know the data we are getting as the output of this model is fed into another system what if this system is taking the input as categories like high, medium or expensive in this case we don't have to worry about the precision of the output of the network as much as we thought we should rather we should focus on making this a classification problem which would be more simple since there are only 3 range of values compared to any possible values for the prices.
Get the Data
Generally, we have to get the data from a relational database where the files will be managed we need to explore the data and write functions to fetch data from there and convert it to the format that we are required but we are not going to do that here as always I would be doing wget to get the data from the Github repo of handson-ml2
!wget https://raw.githubusercontent.com/ageron/handson-ml2/master/datasets/housing/housing.csv
Now lets take a look,
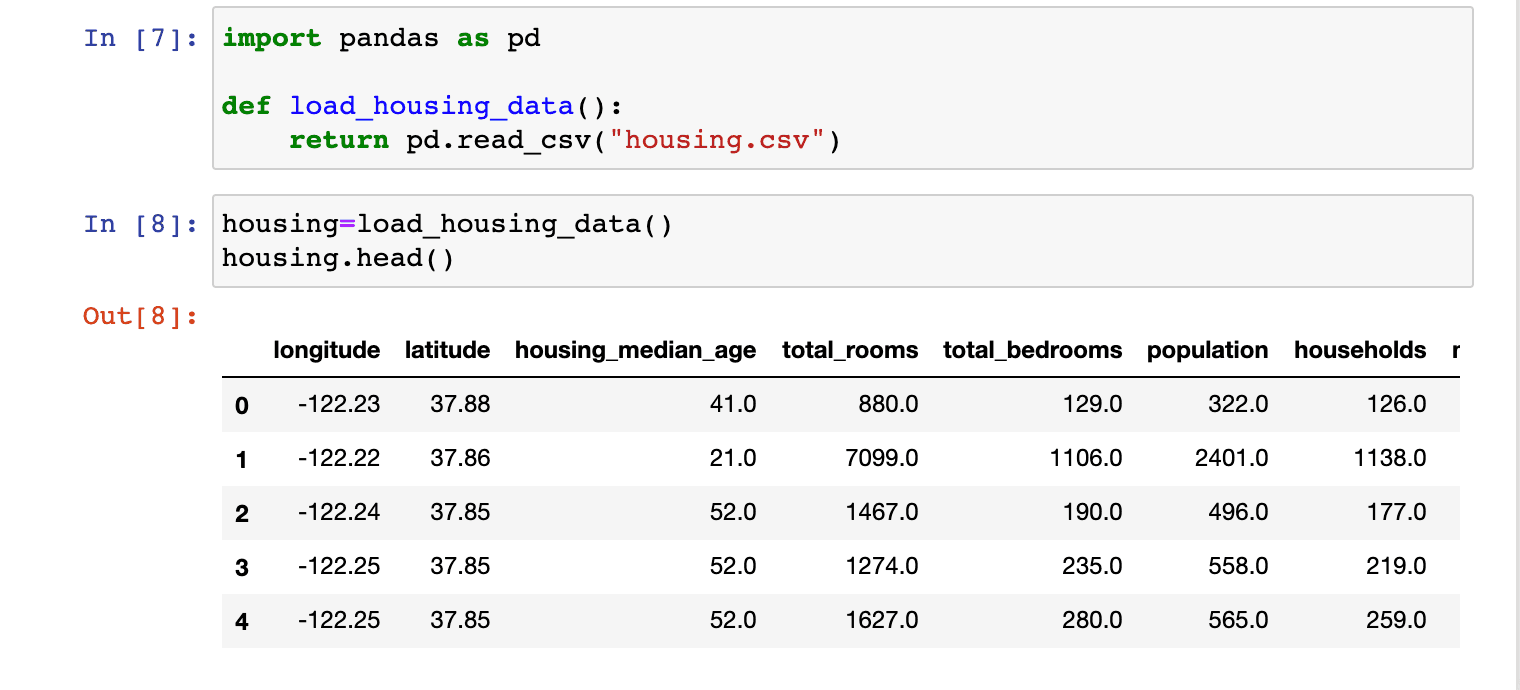
Each row here represents a district and we can see that there are 10 attributes longitude, latitude, housing_median_age, total_rooms, total_bed rooms, population, households, median_income, median_house_value, and ocean_proximity.
If we want to get a quick description of the data we can do housing.info()
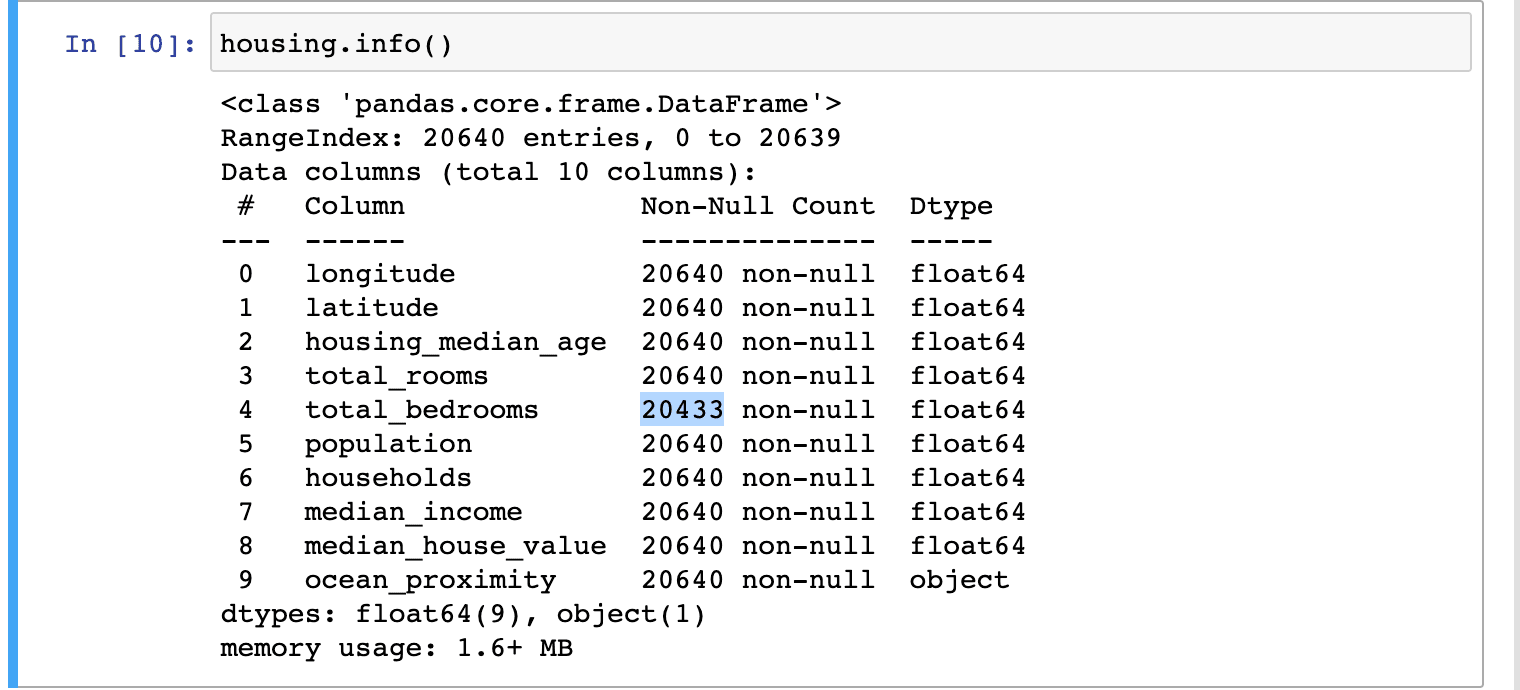
Here we can see that there are 20640 instances of for the dataset, this is not state of the art but for our learning purposes we are going to stick with this. Oh no the total_bedrooms value have 20433 non-null it is suppose to be 20640 it's okay we will take care of this later.
All the values are numerical except for one which is ocean_proximity, these values were repetitive, so it should be a categorical attribute lets take a look at it by using value_counts()

Nice!, we can see how this is categorised and how much of each category are there in the dataset.
How do we see such information for all values we could use the describe() function to see a nice summary.
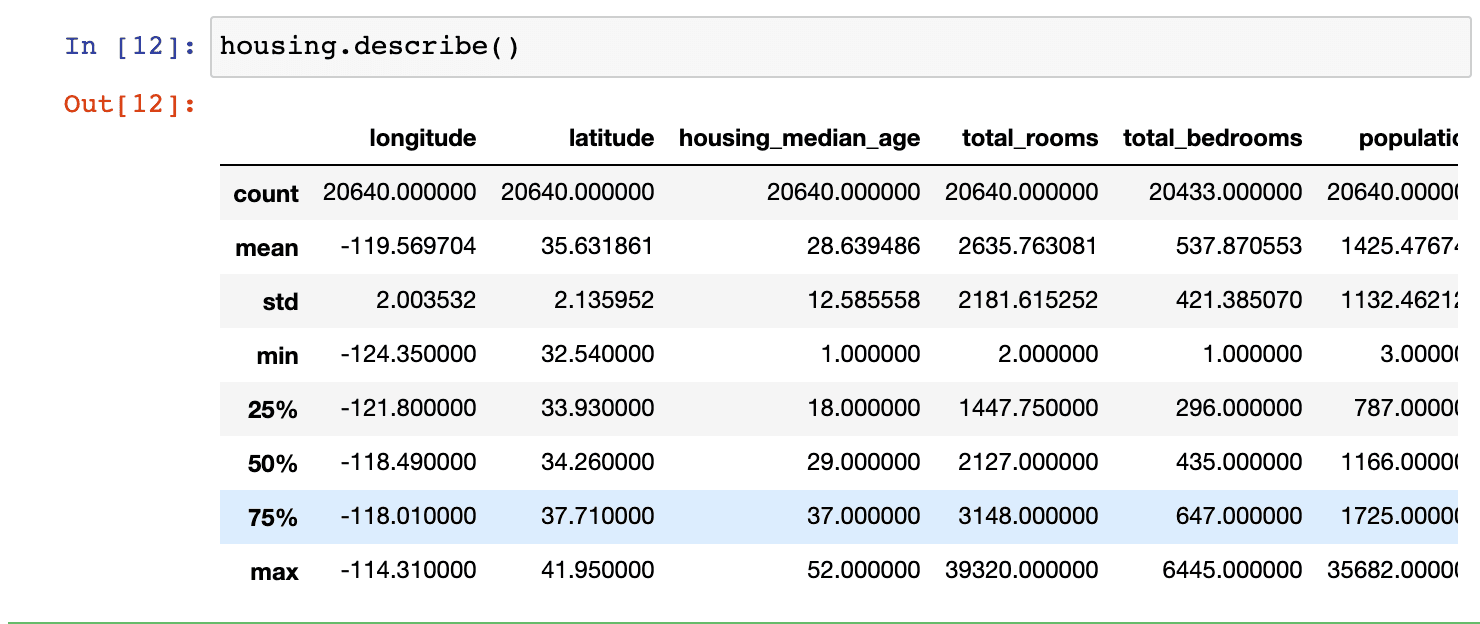
Most of these values are self-explanatory, the 25%,50% and 75% show the interquartile range. This is basically statistics on how the values are spread.
A picture is worth a thousand words
But how about many pictures? (Just wanted to say that I know we are going to compare a plot to a table instead of words 😜)
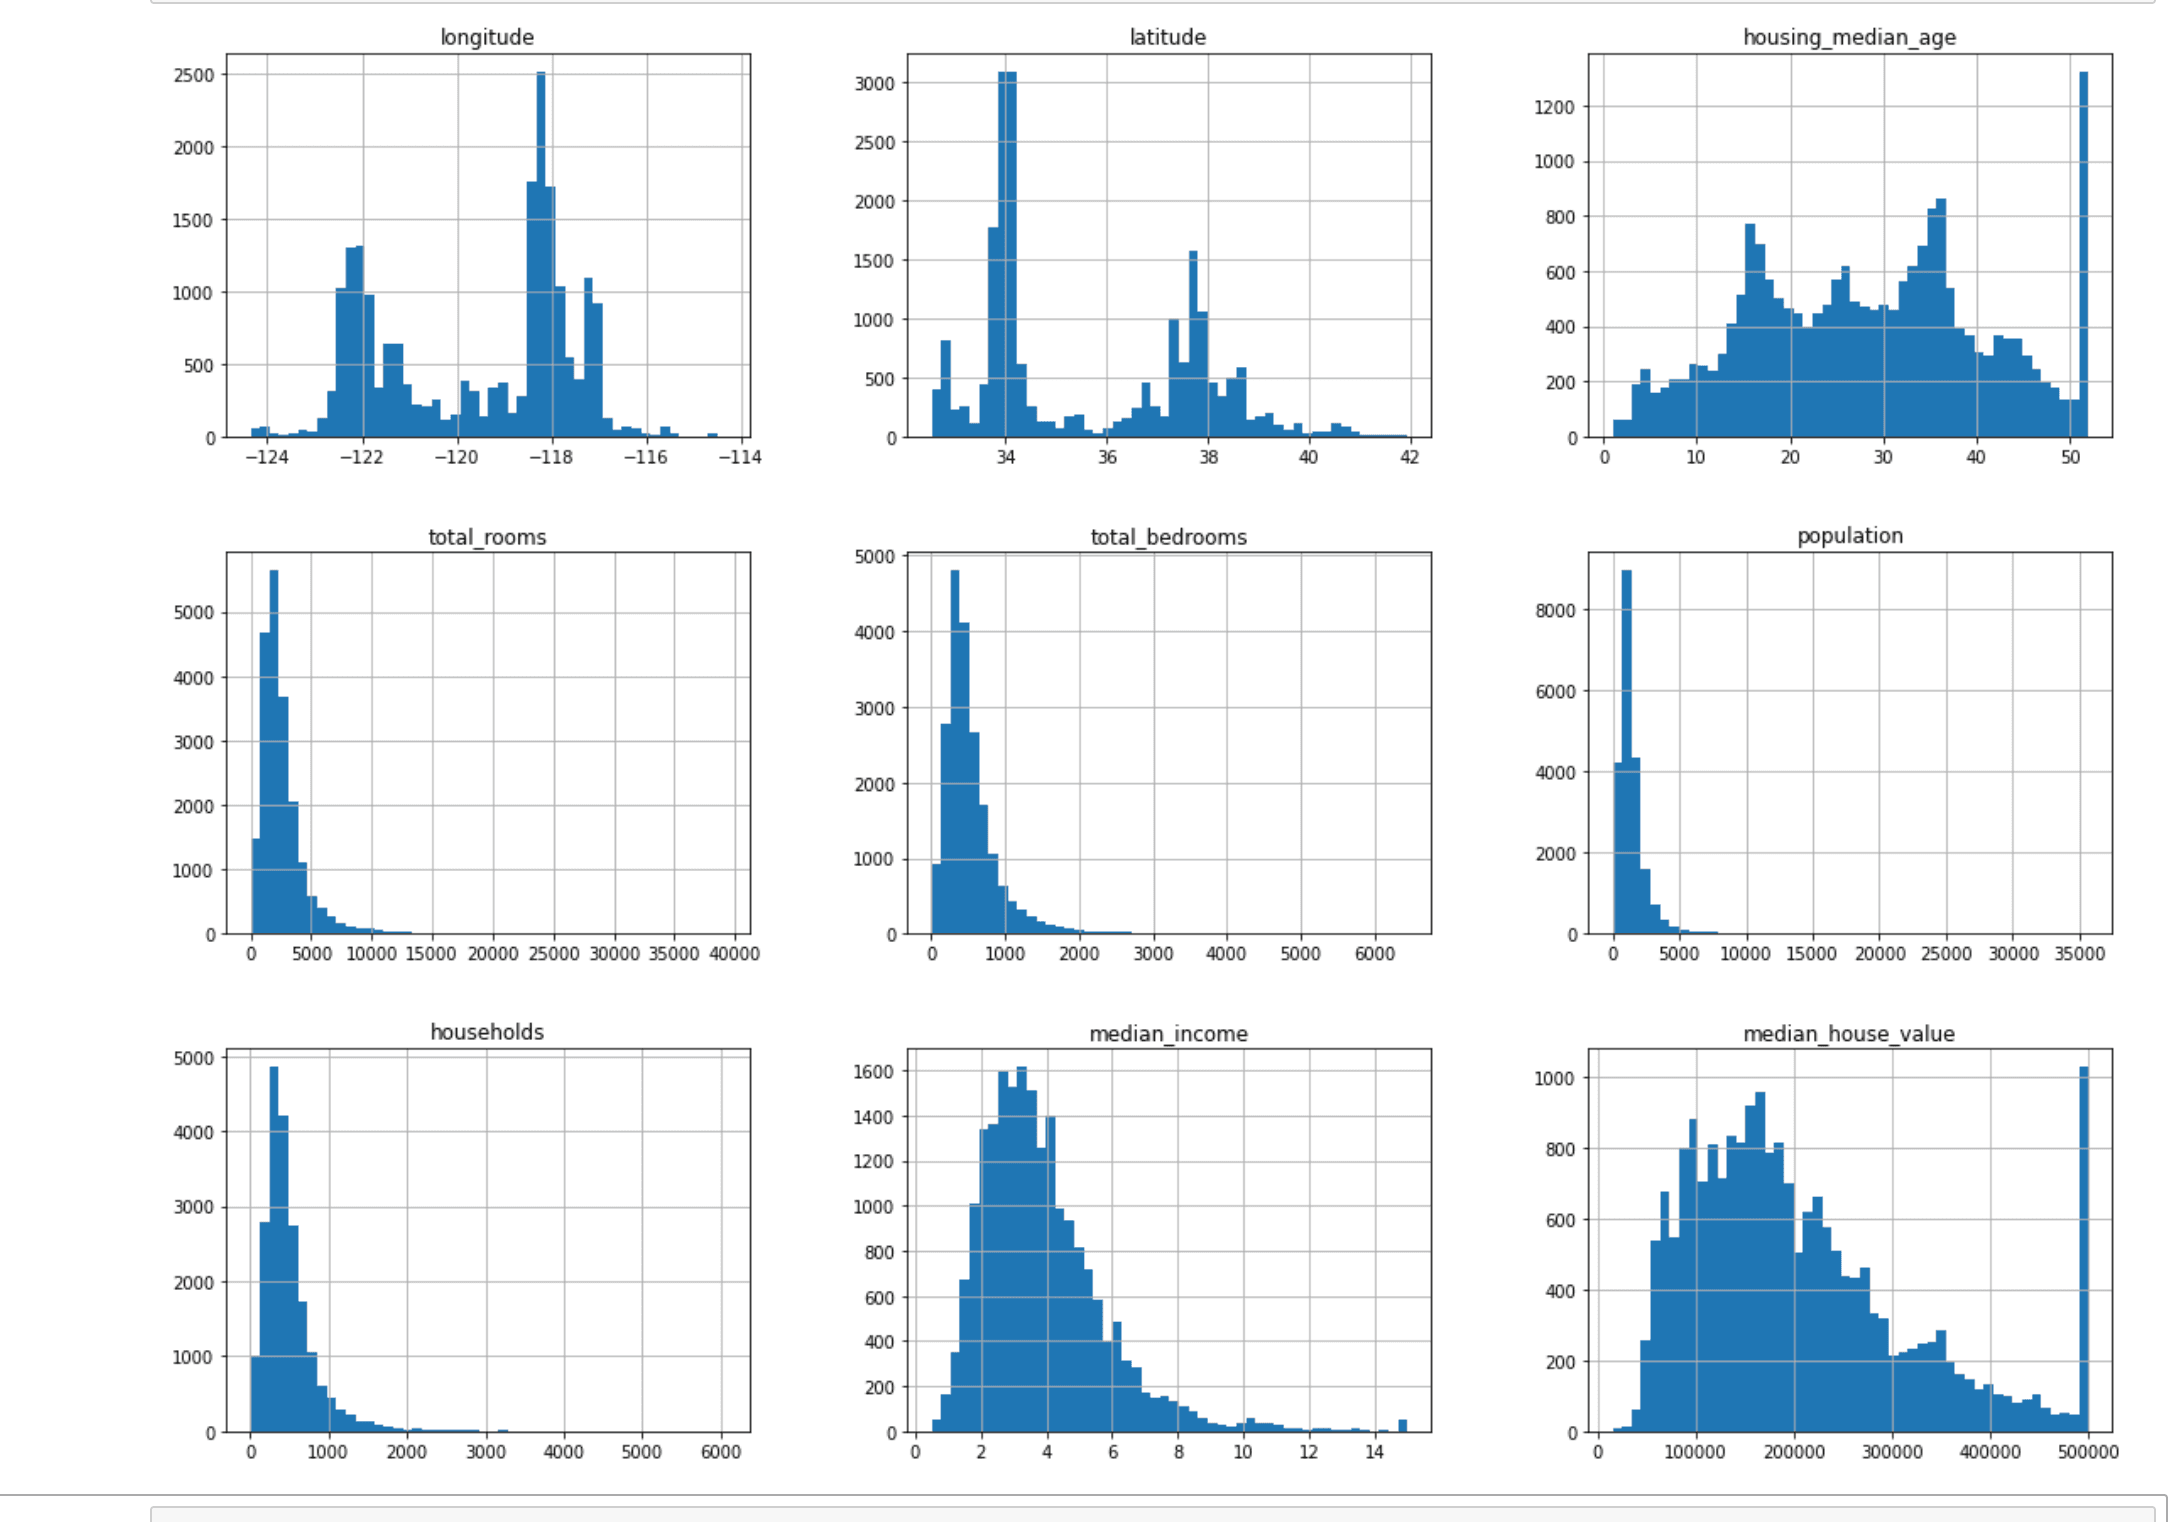
Observations
- The median is not really in USD but instead, it is scaled and capped at 15 for higher median and 0.5 for lower median incomes, You should probably enquire about this with the team collecting the data because it is important to understand what the data looks like.
- The median age and the median house are also capped, median age should not be a problem but median house value should be a problem because this is the output we need to confirm with the client team weather this is ok or they need values beyond $500k If this is an issue either we have to collect proper labels or remove those districts from the training set.
- Most of the histograms are tail-heavy they extend much farther to the right of the median than to the left. Ideally we are looking for a bell-shaped distribution.
Create a test set
The data snooping bias is a statistical bias that appears when exhaustively searching for combinations of variables, the probability that a result arose by chance grow with the number of combinations tested. This could happen if we move part of our data as a test set.
Creating a test set is generally easy we just need to randomly pick some instance ideally 20% and set them aside.
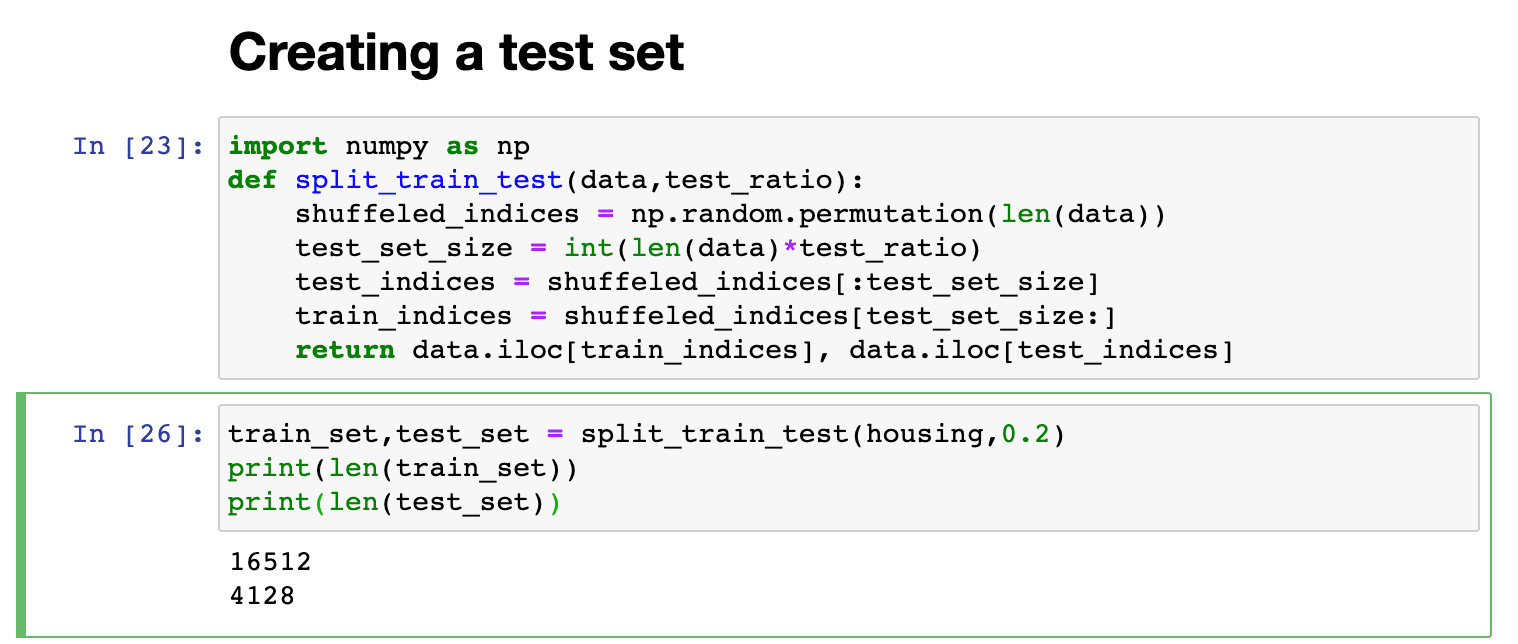
This works very well but it is not the best option because if we run the cell again a different set of data is taken and eventually the model will learn the whole dataset inhibiting the whole point of having the test train split so one way to fix that and the most common way used generally while exploring data is to set a random seed by using np.random.seed(42) before calling the np.random.permuation() this will make sure that it always generates the same shuffled indices. but this will break next time we fetch an updated dataset.
One solution here would be to use an instance's identified and decide whether or not the particular data should go to the test set. It would only go to the test set iff the has is lower or equal to 20% of the maximum hash value. This ensures that the test set remains constant across multiple run even after the data is refreshed.
from zlib import crc32

def test_set_check(indentifier,test_ratio):
    return crc32(np.int64(identifier))& 0xffffffff < test_datio *2**32

def split_tain_test_by_id(data,test_ratio,id_column):
    ids = data[id_column]
    in_test_set = ids.apply(lambda id_: test_set_check(id_, test_ratio))
    return data.loc[~in_test_set], data.loc[in_test_set]
This should work but the only problem is there is no uniquely identifying column so we have to use the row index for now.
housing_with_id = housing.reset_index()
train,test = split_tain_test_by_id(housing_with_id,0.2,"index")
If we do this there are some things we need to keep in mind,
- When a new data comes we need to make sure it gets appended to the end of this dataset.
- We should never delete any rows.
If we cannot guarantee any of this not happening then we need to build our own uniq id like lets say by combining latitude and longitude, well that is not going to change for a particular house at-least not for a while.
housing_with_id['id'] = housing_with_id['longitude'] * 1000+ housing_with_id['latitude']
train_set, test_set = split_tain_test_by_id(housing_with_id,0.2,'id')
We can do this or use the in-build train_test_split of sklearn it always allows us to pass in some parameters like random_state to set how much random seed we want to test and test_size to set the split ratio.
Here we have used a very random sampling method which is ok for a large enough dataset but if it is not we might introduce sampling bias, this is same to what we have discussed in the earlier blog about the data being representative.
When we are doing a survey or collecting some data we need to make sure that they population is homogenous subgroups these groups are called strata. And the process of sampling population accordingly is called stratified sampling.
So we have seen that the graph was a little bit tail-heavy earlier and we wanted to make sure this is nothing so we ask our expert and we come to know that the median income is a very important part of the predicting the median house price so we need to make sure this data is representative.
In the data we plot previously,
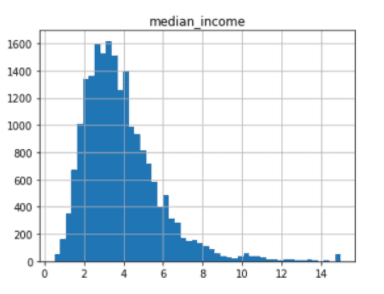
Most part of this data is cluttered around 1.5 and 6 so let us zoom in this portion a little bit to see if they are representative we need to make sure we have sufficient instance for each stratum or our data might be biased.
Let us use pd.cut to create an income category with 5 categories and plot them in a histogram.
housing['income_cat'] = pd.cut(housing["median_income"],bins=[0,1.5,3.0,4.5,6.,np.inf],labels=[1,2,3,4,5])
housing['income_cat'].hist()
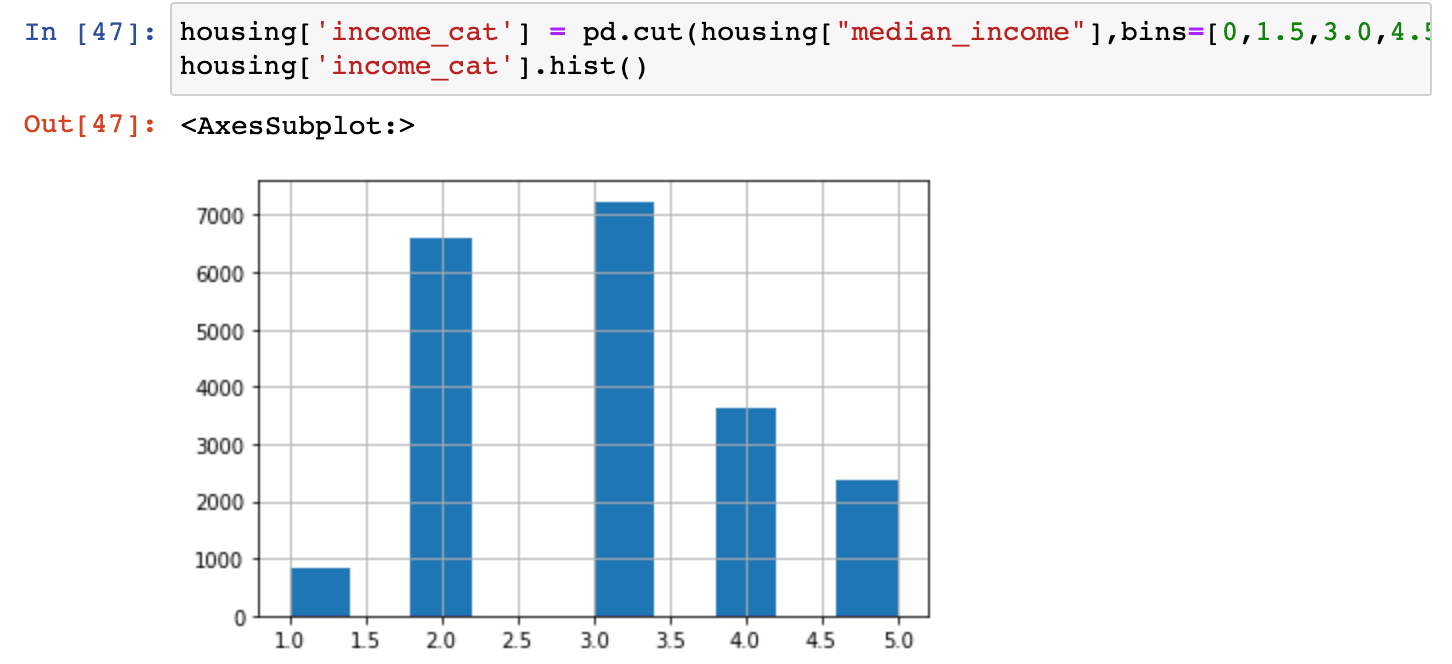
We can do satisfied sampling based on the income category by using Sklearn's StratifiedShuffleSplit class.
from sklearn.model_selection import StratifiedShuffleSplit

split = StratifiedShuffleSplit(n_splits=1,test_size=0.2,random_state=42)
for train_index,test_index in split.split(housing,housing['income_cat']):
    strat_train_set = housing.loc[train_index]
    strat_test_set = housing.loc[test_index]
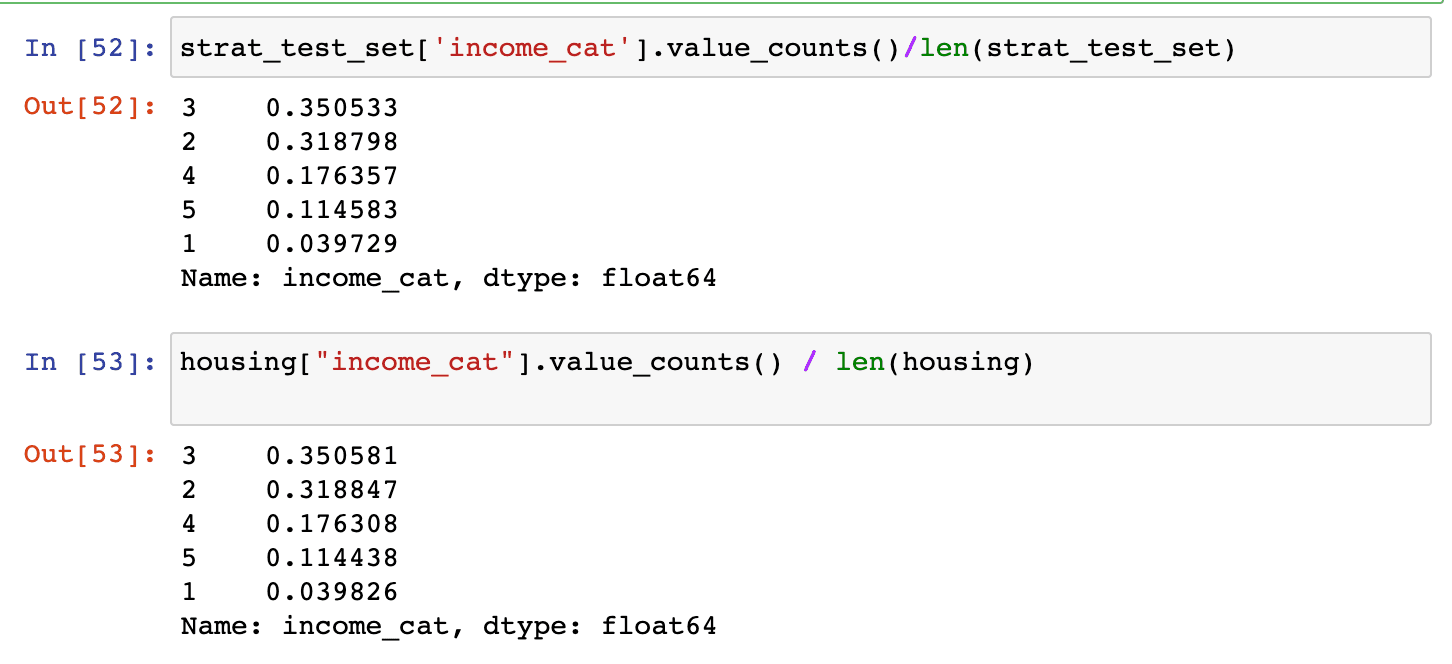
Let's see this in the full dataset and compare the income category proportions in the overall dataset.
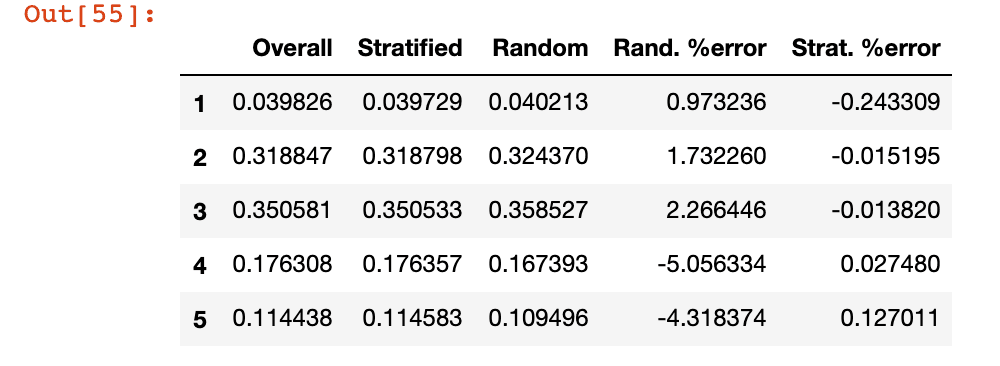
We can see that the category proportion generated using satisfied sampling bias is almost similar to the overall dataset while the once generated using purely random sampling is quite skewed.
We don't need any unwanted attributes while training so lets remove the income_cat attribute we used to explore the data before we start any training.
for set_ in (strat_train_set, strat_test_set):
    set_.drop("income_cat", axis=1, inplace=True)
Discover and Visualize the data to gain insights
Now it is time to visualise the data now that we have set aside the test set. If our training set is very large it is generally good to set aside a visualisation set just to do some exploration. But out test set if fairly small so we are good to go.
Visualising geographicsl data
We can first do a scatter plot of all districts with latitude and longitude since we are dealing with geographic data.
housing = strat_train_set.copy()
housing.plot(kind="scatter",x="longitude",y="latitude")
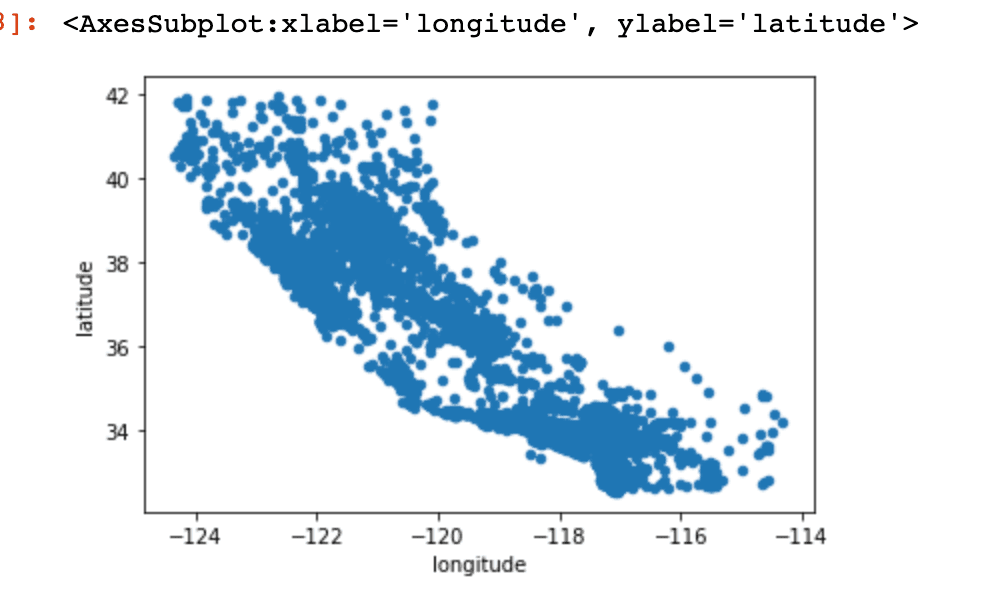
Reminds you of the map of California ?

Yeah probably because it is. But we cannot see any particular patten so lets set the alpha to 0.1
housing.plot(kind="scatter",x="longitude",y="latitude",alpha=0.1)
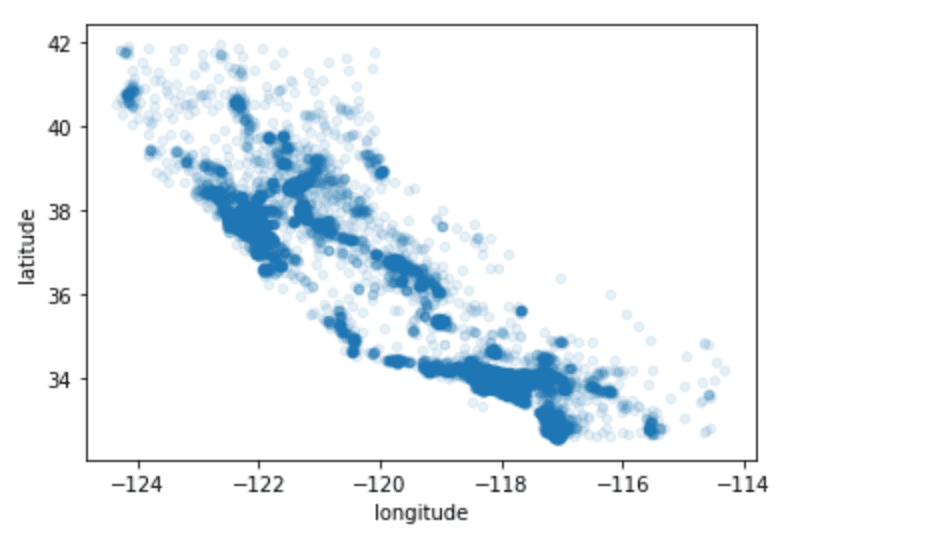
This looks much better we can clearly see the high-density areas, namely the Bay Area and around Los Angeles and San Diego.
For us to understand this better let us do something and set the district population to represent radius of each circle and colour represent the price. Also set our cmap to jet so that it is better range of colours for visualisation.
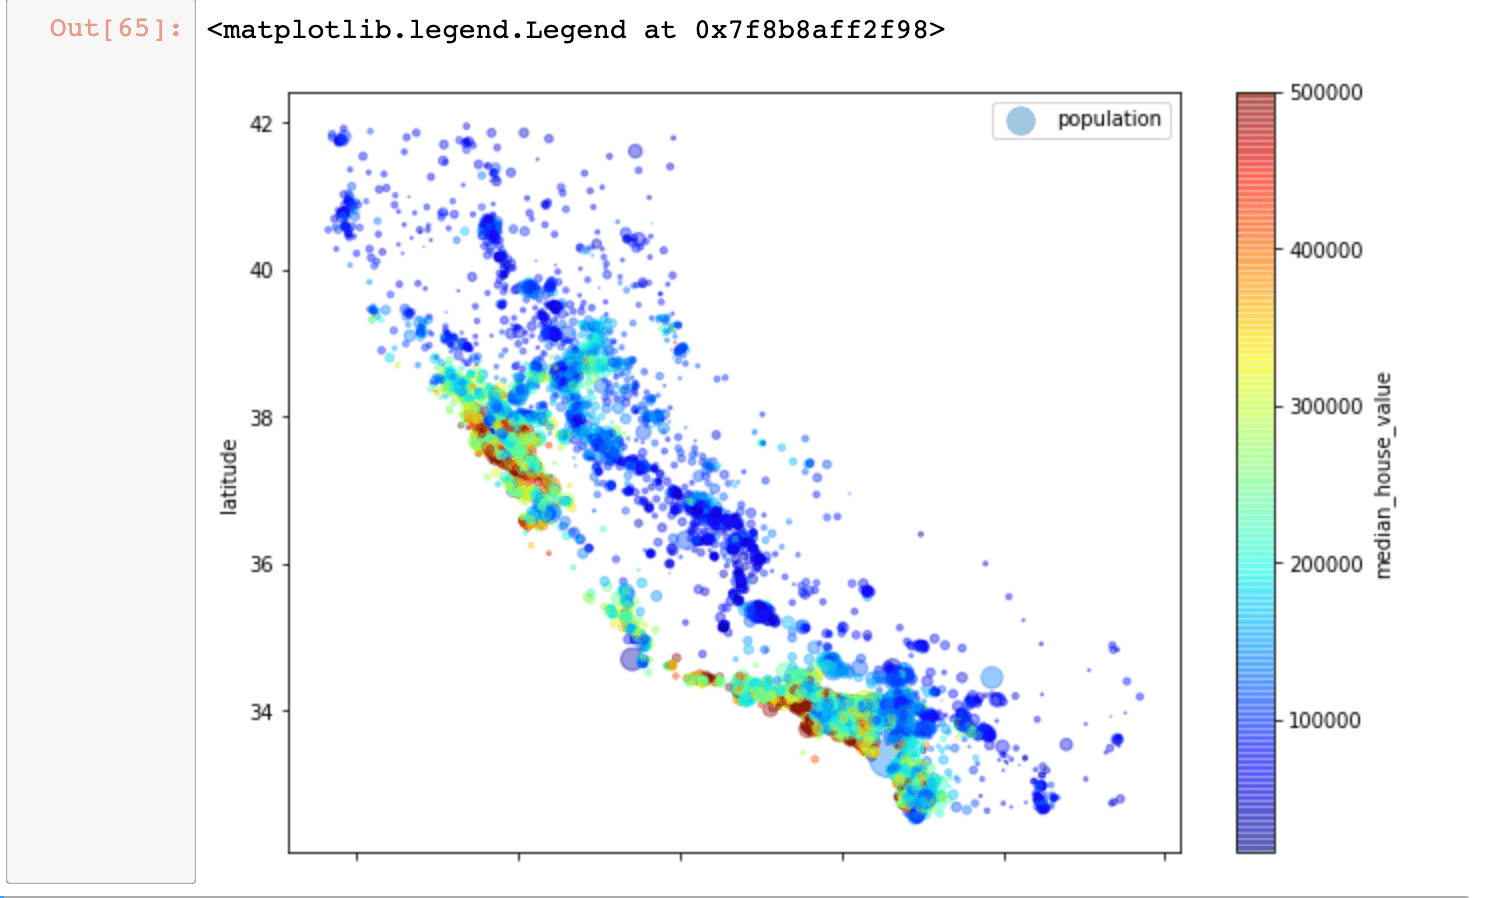
Looks like the housing prices are very related to the location and the population density as expected. We could probably use some clustering algorithm to detect the main clusters but the ocen proximity while being useful for this may not be the wise choice as the prices in costal districts are not too high.
Looking for correlations
We can construct a correlation matrix by looking at how much each attribute correlates with the median house value by using standard correlation coefficient.
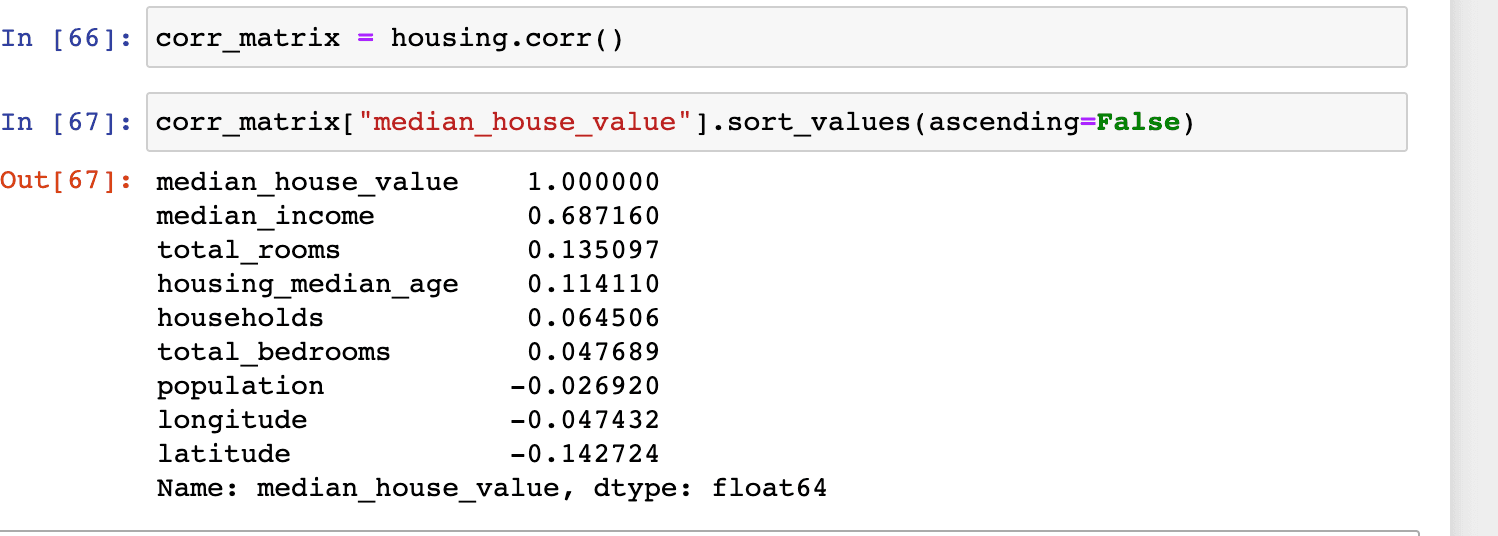
values close to 1 shows a strong correlation such as, as the median_income goes up the median house value also go up. Values close to -1 shows negative correlation. If the value is close to 0 this means there is not linear correlation.
Another way to check for a correlation is to use the pandas scatter_matrix function which plots every numerical attribute against every other so since we have 11 attributes we will get 11*11 results which is not that useful so lets just take a look at the important once.
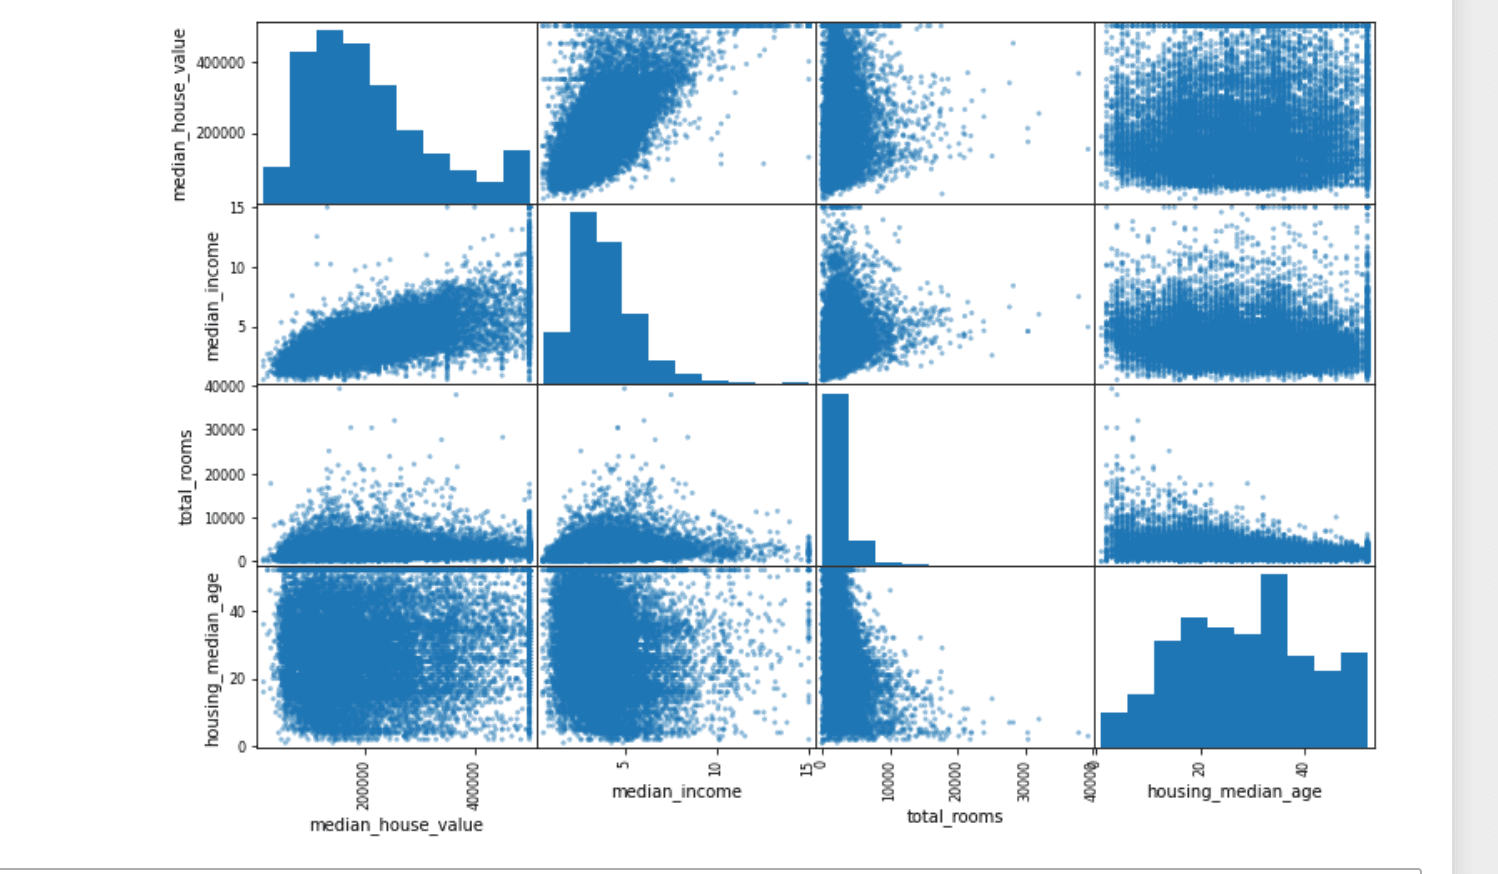
Median income looks like the most promising attribute so let's zoom in on that a little bit.
housing.plot(kind="scatter", x="median_income", y="median_house_value",
                 alpha=0.1)
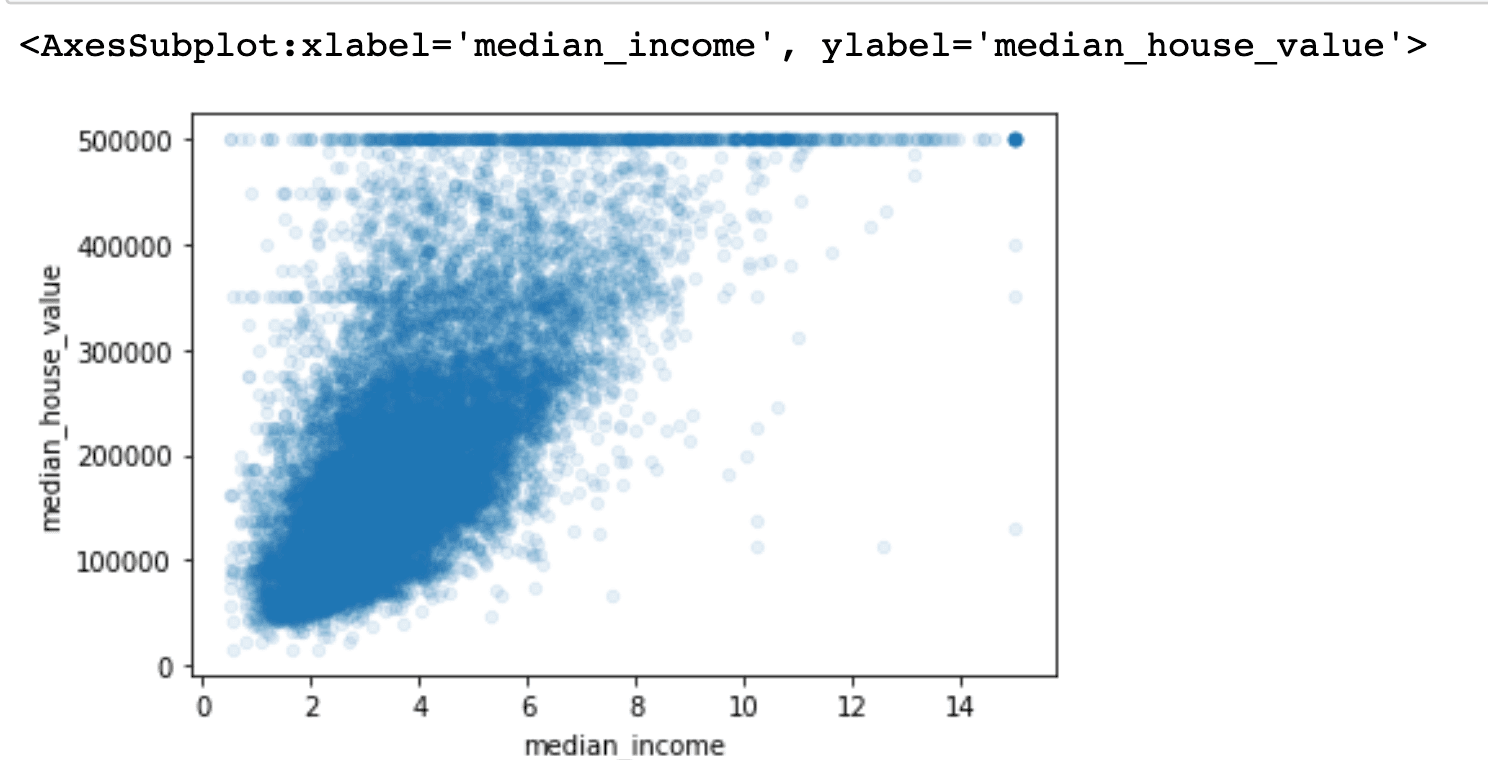
The correlation is strong and we can see an upward trend and as we suspected a straight line at $500k but to our surprise, there are some other straight lines as well around $450k, $350k, $280k and so on. We might have to remove this to prevent the model from learning to reproduce these skewed patterns.
Experimenting with attribute combinations
There are some attributes like rooms per household and a total number of bedrooms we need something like rooms per household and population per household so these would be some interesting attributes we can form using the exciting data. So let's do that.
housing["rooms_per_household"] = housing["total_rooms"]/housing["households"]
housing["bedrooms_per_room"] = housing["total_bedrooms"]/housing["total_rooms"]
housing["population_per_household"]=housing["population"]/housing["households"]
How do we know this might create any patterns well obviously by looking at the correlation matrix.
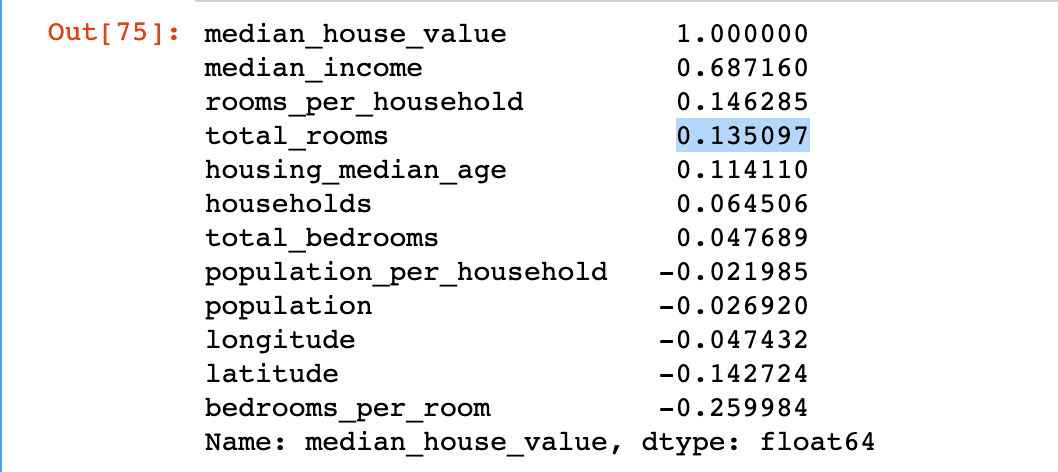
Woh! the bedrooms_per_room is more correlated to the median_house_value than the total_rooms. The number of rooms per household also seems to be more informative because the bigger the house the more expensive it is.
Preparing the data for Machine learning algorithms
Now that we have done enough exploration of the data we are ready to start cleaning the dataset. The first thing to do before this is to split the data into predictors and target values since we don't have any transformation to apply to the target values.
housing = strat_train_set.drop("median_house_value",axis=1)
housing_label = strat_train_set["median_house_value"].copy()
We are making a copy here so that we do not mess up the initial data.
Earlier we noticed that there are some data that is missing on the total_bedrooms session we have three option to rectify this.
-
Get rid of the corresponding district
housing.dropna(subset=["total_bedrooms"]) -
Get rid of the whole attribute
housing.drop("total_bedrooms",axis=1) -
Set values to some value (zero, the mean, the median, etc.)
median=housing["total_bedrooms"].median()
housing["total_bedrooms"].fillna(median, inplace=True)
If we choose this option we need to computer the median value on the training set and fill the missing values in the training set as well as save the median we computed to replace on the test set. And when the system is live we need to replace the same in live data as well.
Sklearn provides a handy function to deal with missing values SimpleImputer.
We can specify an instance of imputer saying that we need to replace missing values with the median? why are we doing this when we can do what I described above, well once the system is live we cannot say whether the input data will have some missing values so it's better to have a strategy ready for all the values. In our case that is median.
from sklearn.impute import SimpleImputer

imputer = SimpleImputer(strategy="median")
We can only apply this to numerical data so let's drop the ocean_proximity parameter in a copy of the data frame. And fit the data in the imputer.
housing_num = housing.drop("ocean_proximity",axis=1)
imputer.fit(housing_num)
The statistics_ variable will contain the values calculated.

Let's just make sure its the same as median for sanity check.

Now we can use the imputers transform function to replace missing values with these values the return type for this function in a NumPy array so we need to convert this to a data frame for training.
X = imputer.transform(housing_num)
housing_tr = pd.DataFrame(X,columns=housing_num.columns)
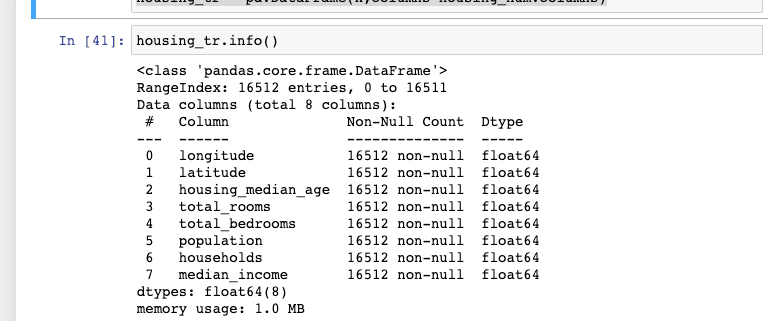
As we said earlier lets check the summary of the data to see if the missing values are filled.
Handling Text and Categorical Attributes
Machine Learning algorithms prefer to work with number so we should convert any text attributes to numbers. Scikit-Learn has a class called OrginalEncorder just for this.
from sklearn.preprocessing import OrdinalEncoder
ordinal_encoder = OrdinalEncoder()
In our dataset ocean_proximity is the one attribute we should be chainging
housing_cat = housing[["ocean_proximity"]]
housing_cat.head(10)
housing_cat_encoded = ordinal_encoder.fit_transform(housing_cat)
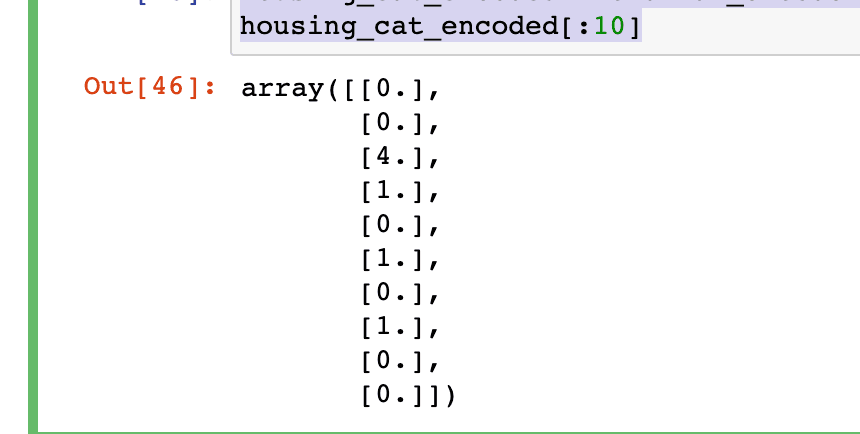
We can see the categories by looking at the categories_ variable.

The problem of expressing in this way is that two nearby values are more similar than two distant once. This would be ok if the categories were something like "bad", "average", "good", excellent" etc.. but here that is not the case so the best thing to do is one-hot encode the vectors.
One hot encoding is a process by which categorical variables are converted into a form that could be provided to ML algorithms to do a better job in prediction.~Hackernoon
Basically this is converting to a binary attribute so the column name would be that particular category with 1 for where it is true and 0 otherwise.
Custom transformer
There might be cases where we need to implement our own custom cleanup operations or combining specific attributes. For these cases we need to implement our own transforms and this can be done by implementing three methods.
- fit()
- transform()
- fit_transform()
We can implement fit_transform() by using TransformerMixin as base class.
We should also add BaseEstimator as a base class this would allow us to get two extra methonds.
- get_params()
- set_params()
which we use for auto-matrix hyper-parameter tuning.
from sklearn.base import BaseEstimator, TransformerMixin

rooms_ix, bedrooms_ix, population_ix, households_ix = 3, 4, 5, 6

class CombinedAttributesAdder(BaseEstimator, TransformerMixin):
    def __init__(self, add_bedrooms_per_room=True):
        self.add_bedrooms_per_room = add_bedrooms_per_room
    def fit(self, X, y=None):
        return self
    def transform(self, X):
        rooms_per_household = X[:, rooms_ix] / X[:, households_ix]
        population_per_household = X[:, population_ix] / X[:, households_ix]
        if self.add_bedrooms_per_room:
            bedrooms_per_room = X[:, bedrooms_ix] / X[:, rooms_ix]
            return np.c_[X, rooms_per_household, population_per_household,
                         bedrooms_per_room]
        else:
            return np.c_[X, rooms_per_household, population_per_household]

attr_adder = CombinedAttributesAdder(add_bedrooms_per_room=False)
housing_extra_attribs = attr_adder.transform(housing.values)
The transformer has one hyper-parameter, add_bedrooms_per_room. The hyper-parameter will help us understand if adding this can help the algorithm become better in generalising. We can add gates to hyperparameters to gate any data we are not 100% sure about.
Feature Scaling
Most machine learning algorithms do not perform well if we are using different scales of values, here in our case the total number of rooms range from about 6 to 39,320 while median income range is from 0 to 15.
There are two ways to scale the attributes.
- Min-max scaling - values are shifted and rescaled so that they end up ranging from 0 to 1. In Scikit-learn, we have a class for this called MinMaxScalar it has a feature_range hyperparameter that lets us change the range if we don't want it to be between 0-1 for some reason.
- Standardisation this is basically it subtracts the mean value and then divide by the standard deviation so the resulting distribution hasunit variance. Standardisation does not bound values to a specific range and hence is less effected by outliners.
Transfomation Pipelines
There are lot of data transformations steps that need to be done in the right order. Scikit-Learn gives us Pipline class to help with such sequences of transformations.
from sklearn.pipeline import Pipeline
from sklearn.preprocessing import StandardScaler

num_pipline = Pipeline([
    ('imputer',SimpleImputer(strategy="median")),
    ('attribs_adder',CombinedAttributesAdder()),
    ('std_scaler',StandardScaler()),
])

housing_num_tr = num_pipline.fit_transform(housing_num)
The only thing to note here is that the last estimator should be a transformer. When we call the pipeline's fit() method it calls fit_transform() sequentially on all the transformers when it reaches the last estimator it would call the fit method.
We have been handling Numerical and Categorical transformation separately until now but we can actually use the ColumnTransfomer class of scikit-learn to handle both together.
The constructor of this also required a list of tuples that contains the name and a transformer.
For our case, we can give the numerical pipeline as one transformer then to handle the categorical part we can give OneHotEncoding. OneHotEncoding returns a sparse matrix whereas the num_pipline returns a dense matrix. This is okay, The ColumnTransformer will estimate the density of the final matrix and returns a sparse matrix. If the density is lower than a given threshold. For our case, it would return a dense matrix.
Select and Train the model
We can start by selecting a very simple model like a linear regressor and then measure the performance on the same.
from sklearn.linear_model import LinearRegression
lin_reg = LinearRegression()
lin_reg.fit(housing_prepared,housing_labels)
Now let's check if this is performing well on some data.

Some of the predictions are off by around 40% this may not be very good for us so let's check the root mean squared error along with the whole dataset and see how the model is performing.

Ok the model is having an error of 6828.1981 this means it would show a error of $6828.1981 in the median housing values range between $120,000 and $265,000. Oops! that is bad.
This is because the model is under-fitting the training data. It is either that the features provided do not give enough information to make a good prediction or the model is not powerful enough.
Let us try out with a more powerful model Decision Tree Regression, this model is good at finding complex nonlinear relationships in the data.
from sklearn.tree import DecisionTreeRegressor

tree_reg = DecisionTreeRegressor()
tree_reg.fit(housing_prepared,housing_labels)

Gosh! 0.0 error that is not possible probably the model is overfitting on the training data only way to find out is by doing cross-validation with the validation set, Scikit-Learn's K-fold cross-validation feature is one of the best ways to do so. It splits the data into subsets called folds than trains and evaluates on the model provided per fold picking a fold every time and evaluating on the rest of the folds.
from sklearn.model_selection import cross_val_score
scores = cross_val_score(tree_reg,housing_prepared,housing_labels,
                         scoring='neg_mean_squared_error',cv=10)
tree_rmse_scores = np.sqrt(-scores)
def display_scores(scores):
    print("Scores:",scores)
    print("Mean:",scores.mean())
    print("Standard deviation:",scores.std())
Let's look at the scores.

Oh no, the Decision Tree model seems to be performing worse than the Linear Regression model.
Let's verify that on by calculating the scores for Linear Regressor model,

That seems about right, the Decision Tree is performing worse than Linear Regression model.
Let's try training with a model called the Random Forest Regressor model. This works by training many decision trees on a random subset of the features then averaging out the predictions. This model uses a technique called Ensemble which is building a model on top of many model pretty neat way to push ML algorithms.
from sklearn.ensemble import RandomForestRegressor
forest_reg = RandomForestRegressor()
forest_reg.fit(housing_prepared,housing_labels)

forest_score = cross_val_score(forest_reg,housing_prepared,housing_labels,
                               scoring="neg_mean_squared_error",cv=10)
forest_rmse_score=np.sqrt(-forest_score)
display_scores(forest_rmse_score)

This model also seems to be overfitting on the data but not as bad as the decision tree model.

The RMSE over the training data seems to be better than the Linear Regression model and more real than the Decision Tree model. So we should probably use this model an use some form of regularisation to avoid the overfitting as well as tweak some hyper-parameters.
Now that we have trained the model it would be a good time to save the model in case our machine goes off or if the kernel time run's out when we are using the cloud this is a good way to make sure we don't loose the model weights.
from joblib import dump

dump(forest_reg,"forest_reg.joblib")
dump(lin_reg,"linear_reg.joblib")
dump(tree_reg,"tree_reg.joblib")
Fine-Tune the model
Now that we have a couple of models lets go through them and find out which one is the best.
Grid Search
Finding out the best hyper-parameter on our own could be a very tedious work so the better approach is to use GridSearchCV that will do the searching job for us and evaluate all the possible combinations of hyper-parameter values using cross-validation.
from sklearn.model_selection import GridSearchCV
param_grid= [
    {'n_estimators':[3,10,30],'max_features':[2,4,6,8]},
    {'bootstrap':[False],'n_estimators':[3,10],'max_features':[2,3,4]},
]

forest_reg=RandomForestRegressor()

grid_search = GridSearchCV(forest_reg,param_grid,cv=5,
                          scoring='neg_mean_squared_error',
                          return_train_score=True)
grid_search.fit(housing_prepared,housing_labels)
Since we don't have any idea of what hyper-parameter should we choose a simple approach is to try out consecutive powers of 10 as what we have done for n_estimators.
The param_grid will first train models first on all 3X4 that is 12 combinators of n_estimator and max_features as specified in the first dictionary. Then it will try our all 2x3 ie..6 with bootstrap parameter off.
So in total 12+6=18 combinations.
Let's check out the best parameters

and also the best estimator

We can also see the whole evaluation scores,
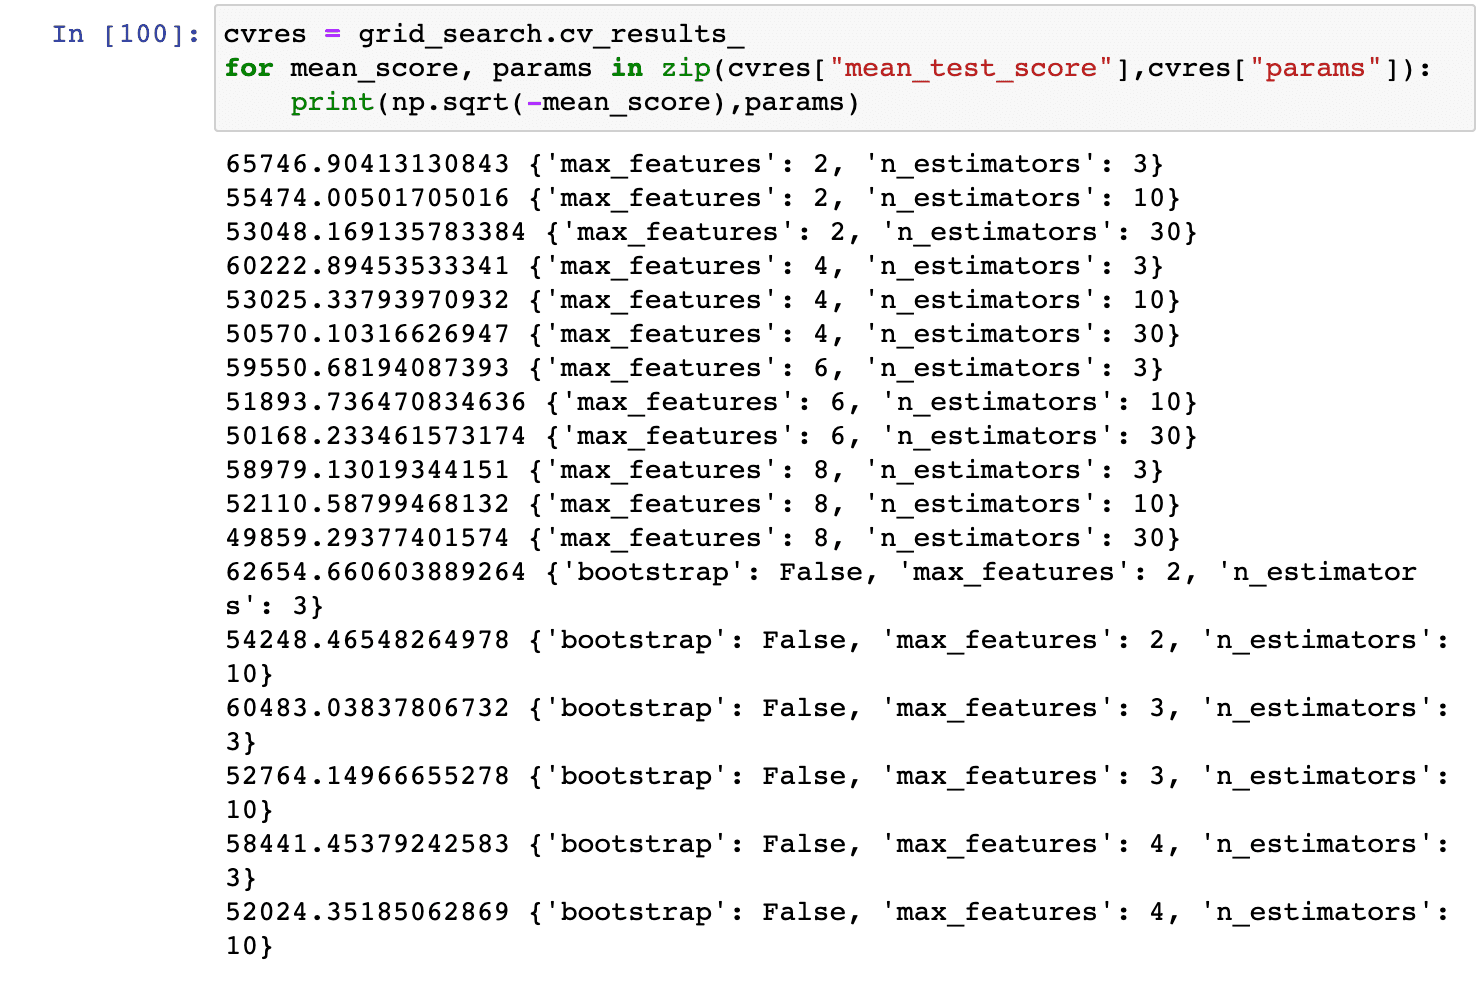
Since we got our best parameters to be max_features 8 and n_estimator to be 30 let's see the RMSE for the same that is 49859.1301934
Random Search
The grid search method works well for the small search space as we had earlier but if the search space is much larger this would not be computed efficiently so we need to move on to random search which would randomly combination by selecting a random value for each hyper-parameter for every iteration.
Ensemble Method
We can combine the models that are performing best, this is called the ensemble model since the group will perform better than the individual models this is especially helpful if they made different kinds of errors.
Analyze the best models and their errors
To get a better understanding of the best model we should look at their errors. Let us look into the feature importance of the Random Forest Regressor.
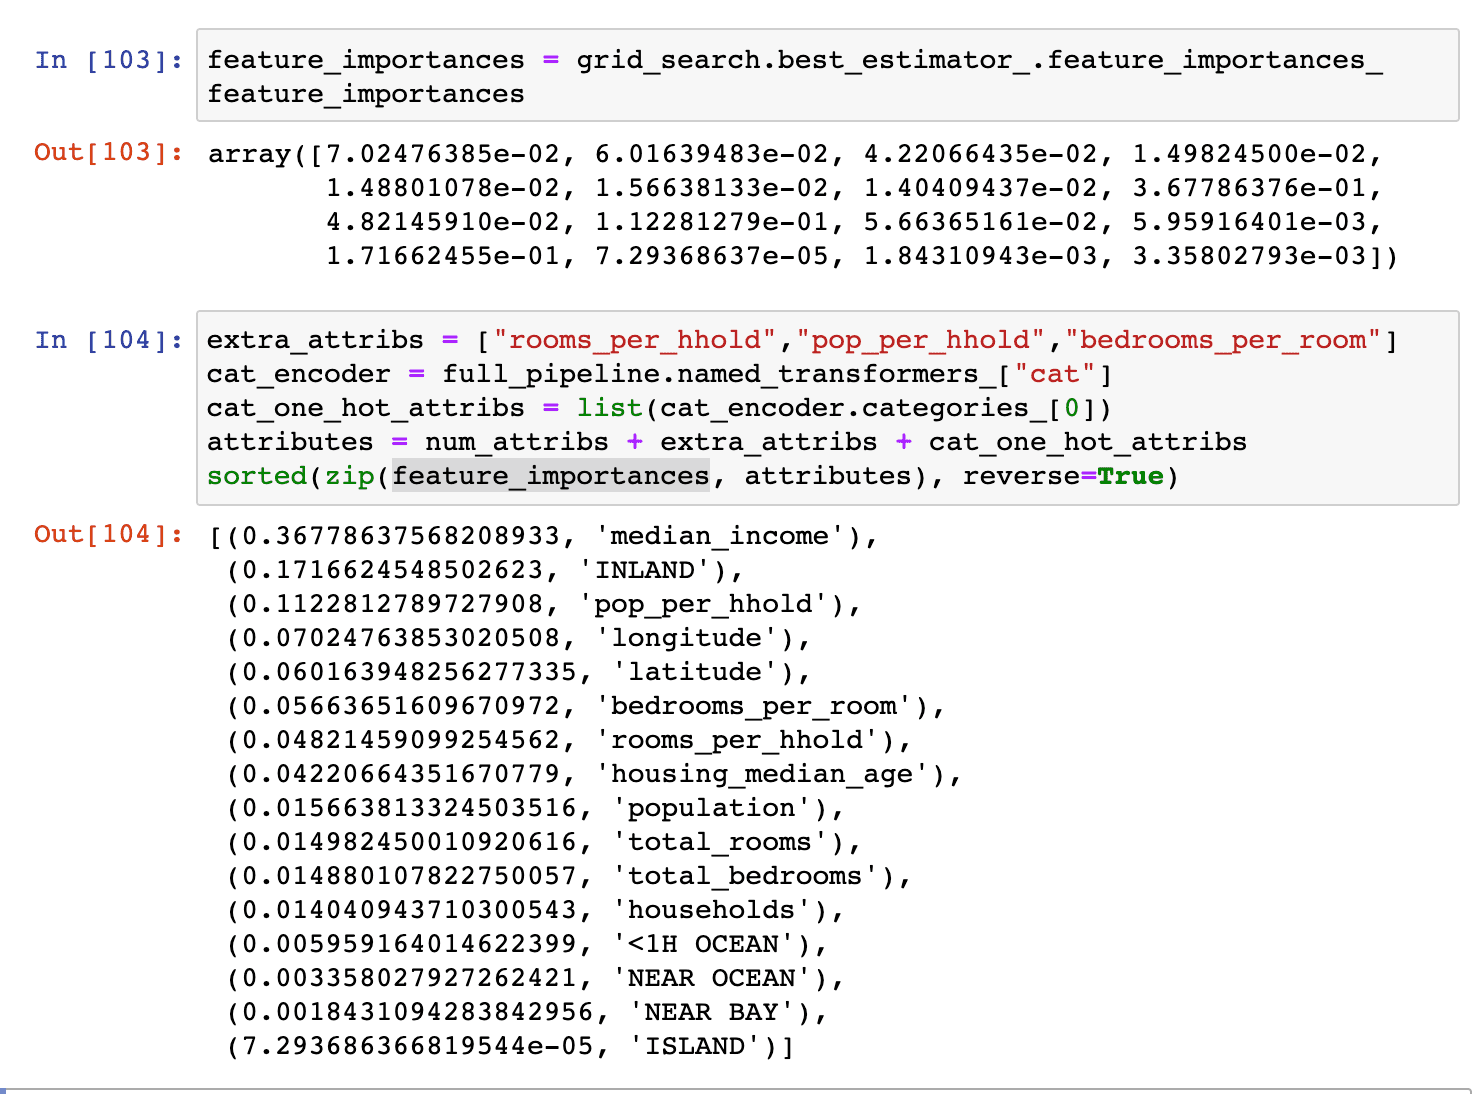
Now that we know the feature information we should probably consider dropping some of the less important feature for example in case of ocean_proxmity only one of its category seems to be of any use.
Evaluate the system on test set
Let's see how are model performs in test data.
final_model = grid_search.best_estimator_

X_test = strat_test_set.drop("median_house_value",axis=1)
y_test = strat_test_set["median_house_value"].copy()

X_test_prepared = full_pipeline.transform(X_test)

final_predictions = final_model.predict(X_test_prepared)
final_mse = mean_squared_error(y_test,final_predictions)
final_rmse = np.sqrt(final_mse)
final_rmse

Ideally this choice of generalisation error would not be convincing for launching the model because this might only be a little better than or exciting model. We can calculate a confidence interval for the generalisation error using scipy.stats.t.interval():

Generally the performance here would be a little off here since the model is being tested on new data compared to validation data during cross validation.
Launch, Monitor and Maintain Your System
We are now ready to put our system to the test and plug it to the input data source and start writing some test.
- We also need to monitor the system performance regularly and trigger alerts when the performance drops.
- We should also monitor the input data as if we feed the model with poor quality signal the model will also train to become poor.
- We should also train our models regularly on fresh data and keep snapshots of the model every now and then.
Exercises
- Try a Support Vector Machine regressor (sklearn.svm.SVR), with various hyper‐ parameters such as kernel="linear" (with various values for the C hyperpara‐ meter) or kernel="rbf" (with various values for the C and gamma hyperparameters). Don’t worry about what these hyperparameters mean for now. How does the best SVR predictor perform?
from sklearn import svm

svm_reg = svm.SVR()

svm_reg.fit(housing_prepared,housing_labels)

svr_score = cross_val_score(svm_reg,housing_prepared,housing_labels,
                               scoring="neg_mean_squared_error",cv=10)
svr_rmse_score=np.sqrt(-svr_score)
display_scores(svr_rmse_score)

housing_predictions = svm_reg.predict(housing_prepared)
svm_mse = mean_squared_error(housing_labels,housing_predictions)
svm_rmse = np.sqrt(svm_mse)
svm_rmse

from sklearn.model_selection import GridSearchCV
param_grid= [
    {'kernel':['linear'],'C':[10., 30., 100., 300., 1000., 3000., 10000., 30000.0]},
    {'kernel':['rbf'],'C':[1.0, 3.0, 10., 30., 100., 300., 1000.0],
     'gamma':[0.01, 0.03, 0.1, 0.3, 1.0, 3.0]},
]

svm_reg=svm.SVR()

grid_search = GridSearchCV(svm_reg,param_grid,cv=5,
                          scoring='neg_mean_squared_error',
                          return_train_score=True)
grid_search.fit(housing_prepared,housing_labels)

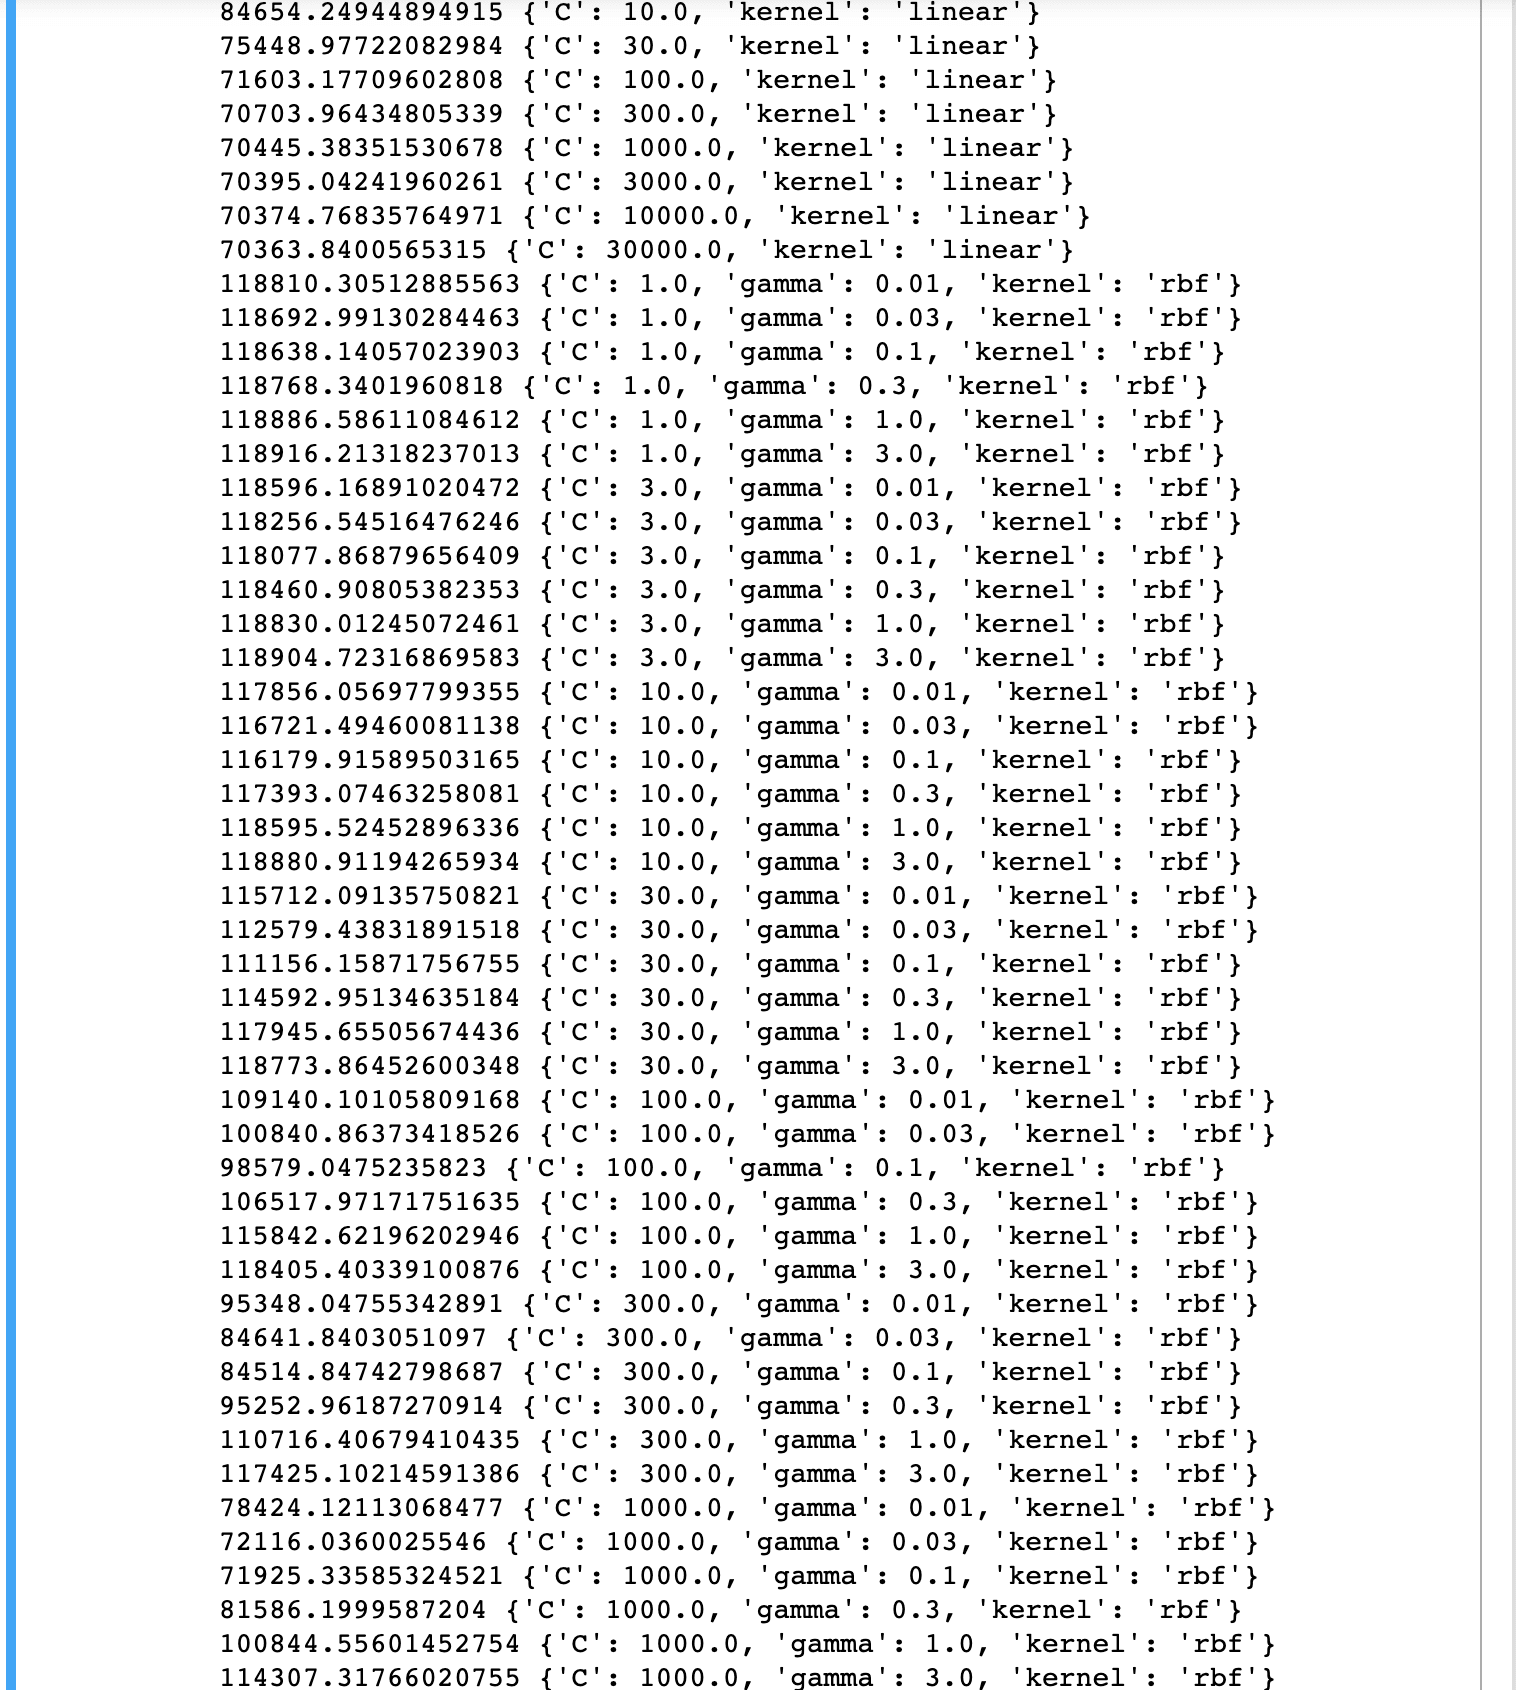
cvres = grid_search.cv_results_
for mean_score, params in zip(cvres["mean_test_score"],cvres["params"]):
    print(np.sqrt(-mean_score),params)

- Try replacing GridSearchCV with RandomizedSearchCV.
from sklearn.model_selection import RandomizedSearchCV

param_grid= [
    {'kernel':['linear'],'C':[10., 30., 100., 300., 1000., 3000., 10000., 30000.0]},
    {'kernel':['rbf'],'C':[1.0, 3.0, 10., 30., 100., 300., 1000.0],
     'gamma':[0.01, 0.03, 0.1, 0.3, 1.0, 3.0]},
]

svm_reg=svm.SVR()

random_search = RandomizedSearchCV(svm_reg,param_grid,cv=5,
                          scoring='neg_mean_squared_error',
                          n_iter=50,random_state=42)
random_search.fit(housing_prepared,housing_labels)
random_search.best_params_

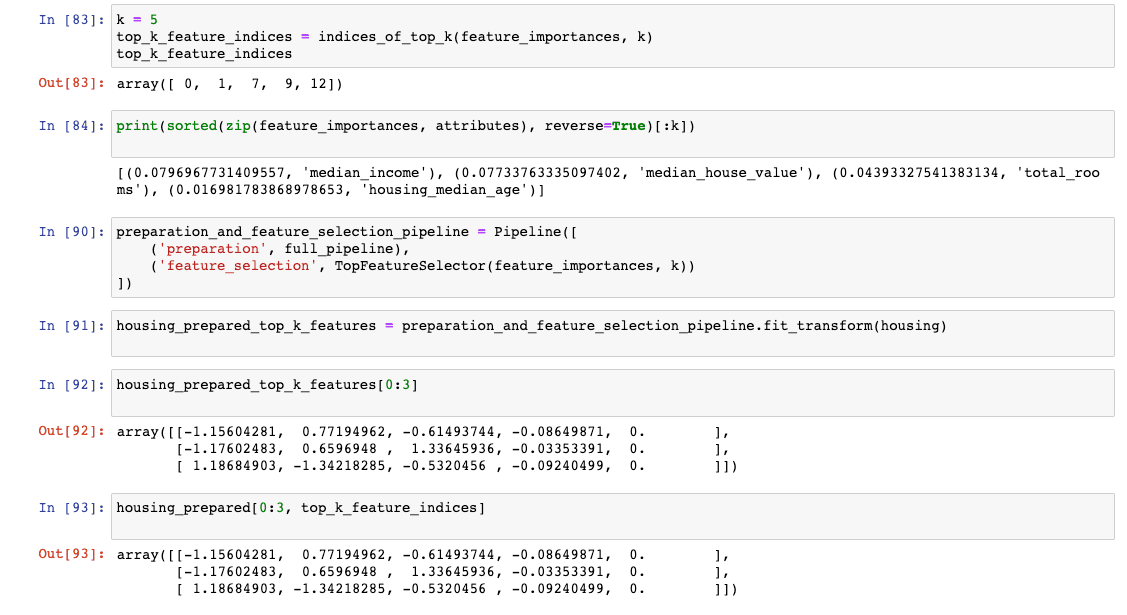
- Try adding a transformer in the preparation pipeline to select only the most important attributes.
from sklearn.base import BaseEstimator, TransformerMixin

def indices_of_top_k(arr, k):
    return np.sort(np.argpartition(np.array(arr), -k)[-k:])

class TopFeatureSelector(BaseEstimator, TransformerMixin):
    def __init__(self, feature_importances, k):
        self.feature_importances = feature_importances
        self.k = k
    def fit(self, X, y=None):
        self.feature_indices_ = indices_of_top_k(self.feature_importances, self.k)
        return self
    def transform(self, X):
        return X[:, self.feature_indices_]
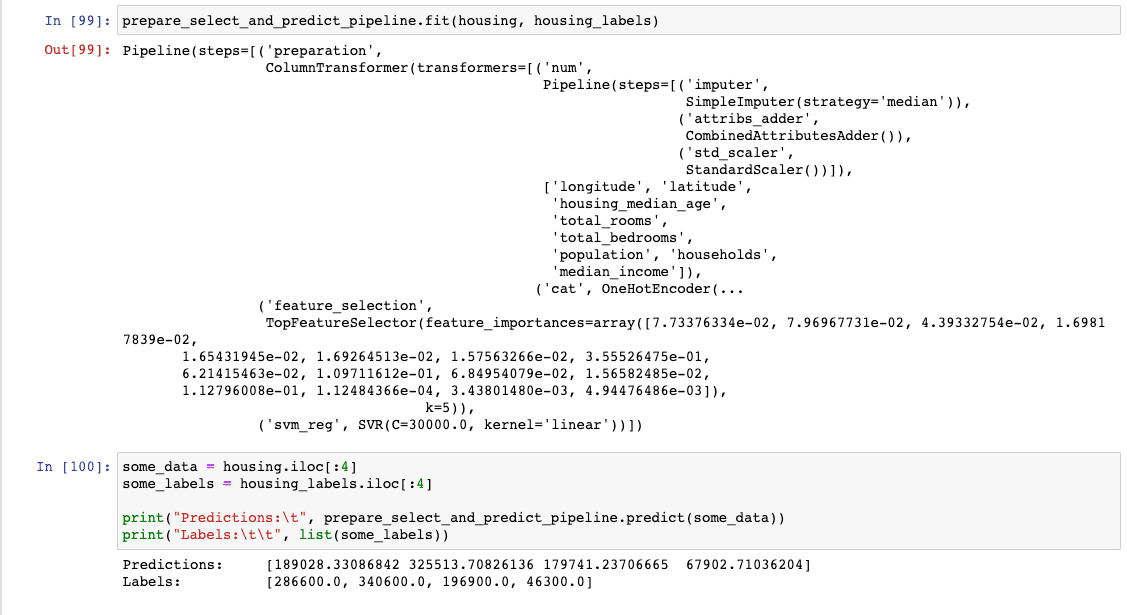
- Try creating a single pipeline that does the full data preparation plus the final prediction.
from sklearn import svm

prepare_select_and_predict_pipeline = Pipeline([
    ('preparation', full_pipeline),
    ('feature_selection', TopFeatureSelector(feature_importances, k)),
    ('svm_reg', svm.SVR(**random_search.best_params_))
])
Sources
Github Repo of handson-ml2 : https://github.com/ageron/handson-ml2
Website to purchase the book : https://www.oreilly.com/library/view/hands-on-machine-learning/9781492032632/
My GitHub repo on Chapter 1 : https://github.com/abhijitramesh/learning-handson-ml2/blob/main/Chapter 1 Types of Machine Learning Systems.ipynb
Subscribe to the newsletter
Get emails from me about machine learning, tech, statups and more.
- subscribers